
From solar panels to wind turbines, renewable energy is the fastest-growing energy source in the US, with a 42% increase in prevalence from 2010 to 2020.1 As such technology evolves, it brings fresh challenges to power quality, including issues like conducted emissions (or supraharmonics). Advanced power quality monitoring systems are more critical than ever to detect these problems and help maintain a resilient, reliable grid.
Recently, Powerside experts worked with a utility on a project where a renewable energy site caused a residential customer’s electrical issues. The case highlights the importance of harnessing advanced power quality (PQ) data to accurately identify and resolve power disturbances — especially as renewable energy generation sources expand.
Malfunctioning Lights, GFCI and Appliance Failures:
An Issue of Paranormal Activity or Power Quality?
Something strange was happening in a residential customer’s house: their lights began turning on and off sporadically (Figure 1). Their dishwasher would have operational issues, and their ground-fault circuit interrupters (GFCIs) tripped frequently — all, notably, on sunny days during peak solar generation.
Figure 1
Rather than calling paranormal investigators, they dialed up their local utility to report the issue.
The utility immediately recognized the disturbance as a power quality problem — one that was indicative of deeper grid disturbances. After visiting the customer site and confirming the reported power behavior, the utility consulted with power quality engineers for next steps.
The Role of Advanced Power System Analysis
Without proper PQ monitoring tools, the utility might have had difficulty determining the exact cause of the problem. Fortunately, a PQube® 3 power analyzer was already permanently installed in the area for IEEE 519 harmonics compliance purposes. This high-end monitoring device is designed to capture a wide range of PQ data points, including:
- Power factor
- Harmonics
- Flicker
- Transients
- Supraharmonics
- And more
Paired with QubeScan monitoring software, the utility could also easily view historical readings from the device — a critical advantage to diagnosing and solving the residential customer’s power issue efficiently.
Powerside and the utility generated several harmonics compliance reports via QubeScan, which confirmed their suspicions: Harmonic distortions and conducted emissions (supraharmonic distortions) were present and causing erratic power behavior.
Let’s take a closer look at each report.
The Reports: Harmonic and Supraharmonic Distortion
1. Harmonics Compliance Report
The Harmonics Compliance Report provided an overview of the integer harmonic distortions within the typical frequency range (up to 3 kHz). Harmonics are voltage or current distortions at multiples of the fundamental frequency (50 or 60 Hz). These distortions can reduce equipment lifespan, cause overheating, equipment malfunction, and lead to inefficiencies.
Harmonics compliance violations were observed at odd harmonics H33, H39 and H45, as seen in Figure 2.
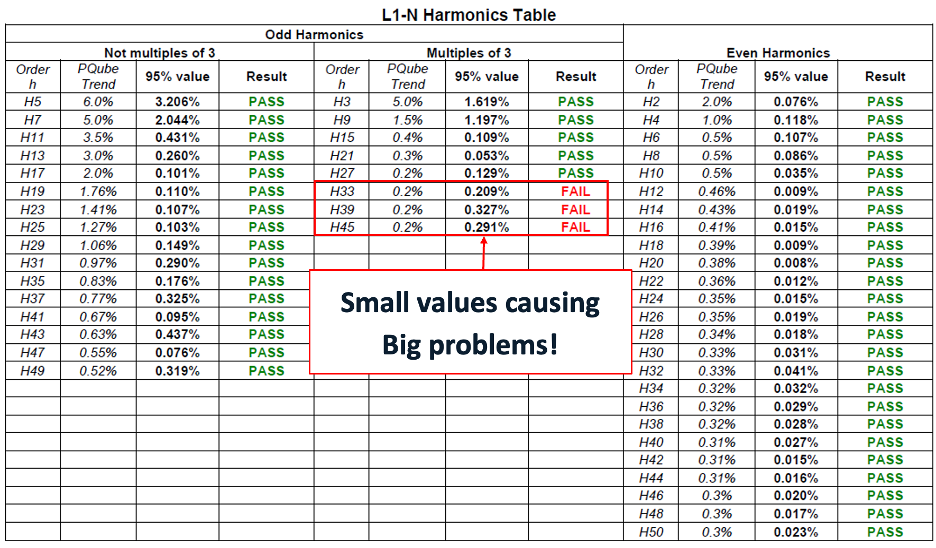
Figure 2
2. Supraharmonics Report: 3.4 kHz
Supraharmonics refers to conducted emissions at frequencies higher than traditional harmonics but below radio frequencies (ranging from 2 kHz to 150 kHz). In the supraharmonics report, a strong, steady state of supraharmonics at 3.4 kHz was observed during the morning hours, as seen in Figure 3.
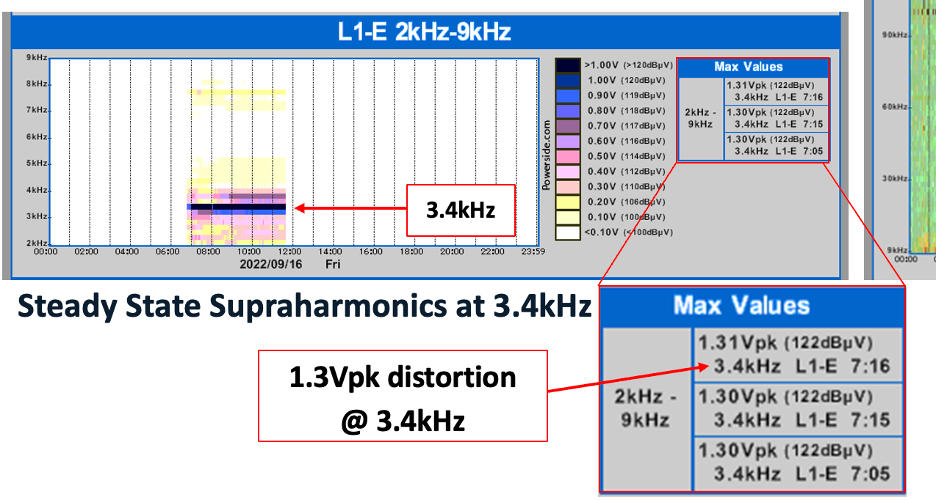
Figure 3
3. Supraharmonics Report: 10 kHz to 12 kHz
The supraharmonics report also confirmed a steady state of conducted emissions at 10 kHz and 12 kHz as shown in Figure 4. These distortions can stem from switching devices like inverters, which operate at high frequencies when converting DC to AC in renewable energy systems.
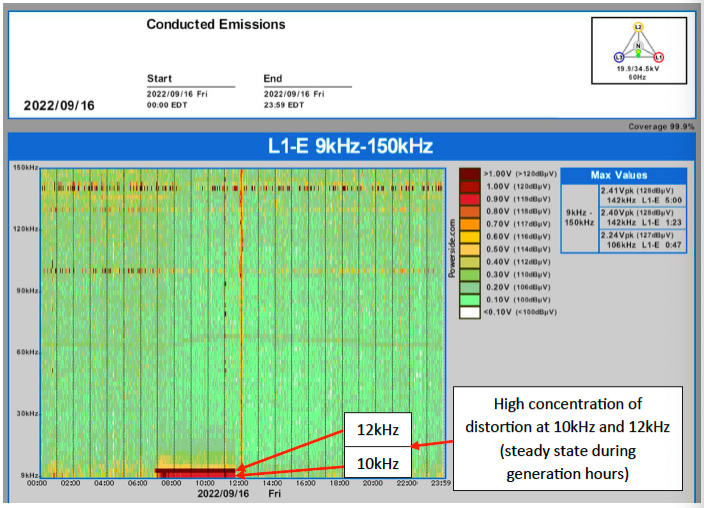
Figure 4
This frequency is well outside what traditional power meters would typically monitor and is one of the unique benefits of a high-end analyzer like PQube 3 in diagnosing the issue.
By analyzing data from QubeScan’s Harmonics Compliance Report and Supraharmonics Reports, the utility identified that supraharmonic disturbances were strongest between 7:00 a.m. and 11:30 a.m., coinciding with solar generation.
Identifying the Source: Solar Site Inverters
The timing of the disturbances led the utility to a nearby 20MW solar farm. To prove the solar inverters were behind the strange power quality issues, the utility isolated the solar site for one week. During this time, the harmonic distortions ceased entirely — confirming the utility’s suspicions.
Inverters are integral to converting the DC voltage generated by solar panels into AC voltage usable by the grid. If the inverter’s switching frequencies are not properly tuned, they can introduce harmonic distortions into the system.
After identifying the problem, the utility worked with the inverter manufacturer to address the issue. A firmware update was implemented to pulse shift the switching frequencies of the inverters, and no further issues were observed or reported.
The Growing Need for Advanced Power Quality Monitoring
This case highlights a broader trend: As renewable energy, electric vehicles and other new technologies grow in popularity, they can place new unanticipated strains on electrical grids. These technologies are often accompanied by power quality issues that are not easily detected with traditional monitoring equipment. Such PQ issues can often go unnoticed until they result in failures, equipment damage or customer downtime.
Supraharmonics, in particular, can be elusive for lower-end meters, leaving utilities without the data they need to diagnose and fix these complex issues.
This is where tools like the PQube 3 power quality analyzer stand out. Unlike many other devices, the PQube 3 is capable of monitoring a wide range of distortions, including supraharmonic frequencies that are beyond the reach of typical power quality monitors.
In this case, the capability of QubeScan power monitoring software allowed the utility to capture detailed data and produce comprehensive reports — including heat maps and supraharmonic trends. This was instrumental in solving the customer’s problem quickly and efficiently. Additionally, the platform may be interrogated remotely, and data shared securely and easily among specialists, speeding up accurate diagnosis.
As the future of the grid continues to evolve, so must our methods for monitoring power quality. Contact Powerside today for expertise in detecting and identifying the power quality issues impacting your operations.
[1] Center for Climate and Energy Solutions, “Renewable energy at-a-glance.” August 24, 2023.