Skip to the content
 Commercial & Industrial Application Note
Case Study
Proper measurement and detection of the emerging supraharmonic threat to the electric power system reliability
Supraharmonics Measurement in DERs, Microgrids
PQube 3
The operation of a microgrid depends on successful integration of DERs, relying on several factors such as hosting capacity, anti- islanding, synchronization and power quality. Modern renewable energy sources use power electronic systems such as rectifiers, DC/DC converters, and DC/AC inverters that are susceptible to emitting power quality phenomena into the network such as voltage instability, harmonics, frequency instability, and flicker. The continuous increase in switching frequencies resulting from these power electronics technologies has led to the emergence of conducted emissions in the range of 2 to 150 kHz (supraharmonic frequency), outside the traditional frequency range for power quality. Supraharmonics have the potential to disrupt network operations by damaging capacitors, disrupting communications, degrading dielectric insulation, and mis-operating relays/controls. These symptoms can negatively affect the operation of street lighting controls, household dimmers, semiconductor manufacturing equipment, medical scanners, security systems, and transportation controls. Traditional technologies used on the grid today may not have the capability to properly measure and detect this new, emerging supraharmonic threat to the electric power system reliability. This paper presents measurement observations of DER impact to voltage & frequency stability, utilizing state-of-art technologies available today. In the first part of the paper, seven test scenarios were performed in a microgrid test bed to intentionally introduce disturbances and measure the resulting impact. In the second part, an unintentional event occurred in the microgrid, and the resulting measurements were recorded and evaluated.
The study was performed in a medium voltage (MV) microgrid with natural gas generators, battery storage, voltage regulators, solar panels, and a wind turbine. The measurement instrumentation in the microgrid includes a set of capacitive voltage divider sensors (0.5 class) certified to IEC 60044-7 and a Powerside PQube® 3 power quality analyzer certified to IEC 61000-4-30 Class A for data collection and analysis of the measurement data.
Instrument transformers (ITs) are key technologies that enable applications for metering, protection, and control of modern power grids. Initiatives such as DERs and optimizing energy efficiency & resiliency are driving a need for high precision sensing technologies that can effectively monitor the state of the modern grid.
Low Power Voltage Transformers (LPVTs) are typically based on either capacitive voltage dividers (CVDs) or resistive voltage dividers (RVDs) and are used to step down the primary MV to an appropriate low voltage signal measured by an intelligent electronic device (IED) such as a meter or controller.
A CVD sensor consists of a series of two capacitive arms: a primary arm with low capacitance value, in the order of few pF, and a secondary arm with high capacitance value, typically hundreds of nF. On the other hand, a RVD comprises high primary resistor, in the order of 10~100 MΩ and low secondary resistor, typically 10~100kΩ. Both technologies involve connections to the primary voltage and secondary voltage is then measured across the secondary arm.A key characteristic of CVD sensor technology used in DER applications is the dynamic measurement range and ability to measure and detect supraharmonics (2kHz~150kHz) phenomenon. LPVTs must maintain accuracy class over a wide band of frequency range. The frequency characteristics of CVD and RVD via the frequency sweeping method is shown in FIGURE 1. A constant voltage was applied, and the output voltage was monitored for both technologies. The cut-off frequencies were 7 kHz and 40 kHz for RVD and CVD respectively. The high cut-off frequency of CVDs makes it suitable for detecting high frequency, supraharmonic phenomenon up to 40kHz.
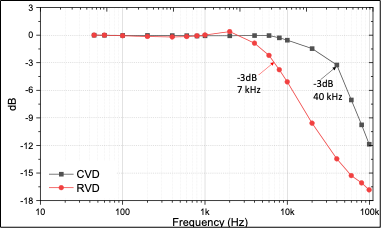
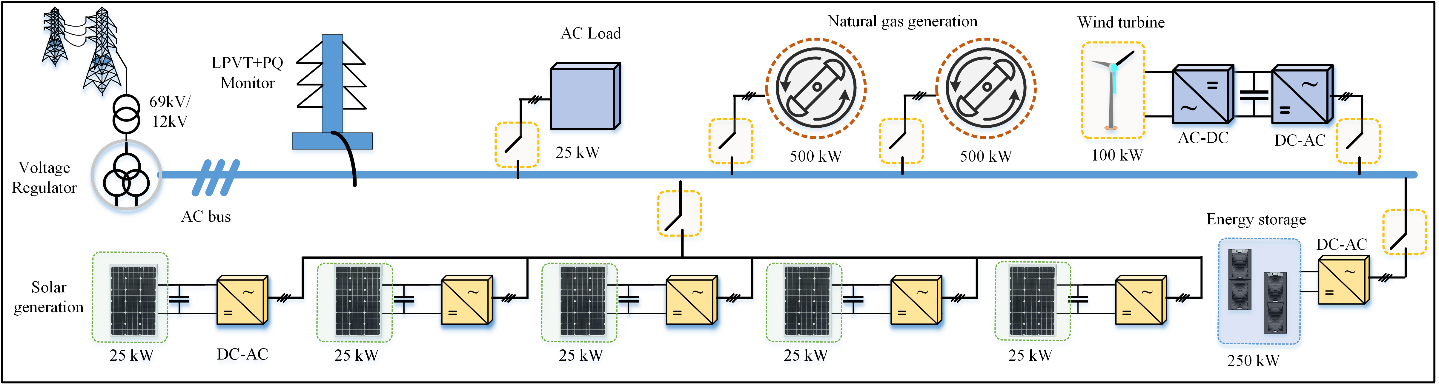
FIGURE 2 represents a simplified scheme of the microgrid test bed under stud. The DERs in the microgrid include natural gas generators, battery storage, solar panels, and a wind turbine. The microgrid services either the on-site research facility and an electric vehicle station or a small distribution feeder serving approximately 200 residential and small commercial customers. The battery energy storage system (BESS) and natural gas generators both have grid forming capability. When islanding only the on-site research center and vehicle charging station, the BESS is used as the grid forming asset. When islanding the distribution feeder, the natural gas generators act as the grid forming asset. In either islanding scenario, the renewable assets are allowed to produce with their output level managed by the microgrid control system. All assets are available for use when the system is grid tied.
Seven test scenarios were performed with the various DER sources in the microgrid. These experiments were performed to intentionally introduce disturbances and measure the resulting impact with two different measurement instruments including low power G&W Accusense CVD sensors and a PQube® 3 power quality analyzer. A view of the voltage magnitude, frequency, conducted emissions (supraharmonic frequencies), total harmonic distortion (THD), and flicker were monitored over this time-period. Based on the data observed, the analysis in this data evaluation will focus on test scenarios 4, 6 and 7 shown in the table below.
Table 1 | Testing Scenarios in Microgrid
| Test Scenario | DER Source | Test Sequence | Time |
|---|---|---|---|
| 1 | Grid Tied Generator | 1. Turn on generators 2. Ramp up generators 3. Turn off generators | 8:00-8:09 AM |
| 2 | Grid Tied Battery | 1. Charge battery 2. Discharge battery 3. Idle battery | 8:10-8:29 AM |
| 3 | Voltage Regulator | 1. Step-up voltage regulator 2. Step down voltage regulators | 8:30-9:09 AM |
| 4 | Islanding all DERs | 1. Transition into Island 2. Transition out of Island | 9:10-10:07 AM |
| 5 | Solar Inverters, Grid-tied & Isolated | 1. Isolate each of the 3 solar inverters 2. Run the 3 inverters independently | 10:08-10:39 AM |
| 6 | Solar Inverters, Islanded & Isolated | 1. Isolate each of the 3 solar inverters 2. Run the 3 inverters independently 3. Run all inverters simultaneously | 10:40-11:40 AM |
| 7 | Wind Turbine, Islanded & Isolated | 1. Turn wind turbine on 2. Turn wind turbine off 3. Turn wind turbine on 4. Turn wind turbine off | 11:41-11:59 AM |
Voltage fluctuations are systemic variations of the voltage envelope or random voltage changes. Industry standard IEC 61000-4-30 indicates voltage dip (sag) thresholds are typically in the range… Continue reading by downloading the whitepaper.