Skip to the content
Whether in Data Centers or heavy industry, whether delivered by the grid or locally induced, power sags (a.k.a. intermittent voltage reductions) and swells (a.k.a. intermittent voltage increases) are a constant threat to business productivity and equipment reliability. In the best case, equipment may ride through minor reductions of short duration. In contrast, larger, longer reductions can result in random process variations, malfunctions, equipment tripping off, and extended recovery or repair times. Likewise, voltage excess can result in equipment over-speed, excess heating, or protective tripping.
Dating back to the 1970s, the Computer and Business Equipment Manufacturers Association (CBEMA) sought to codify voltage deviations and provided a simplified standard approach to categorizing them and how to think about them. What began life as the CBEMA Power Acceptability Curve, which defines the operating envelope for IT equipment based on voltage deviation and duration, has been supplanted in 2000 by the Information Technology and Industry Council (ITIC) Curve, with similar properties.
So, let’s go through the graph, below, in detail.
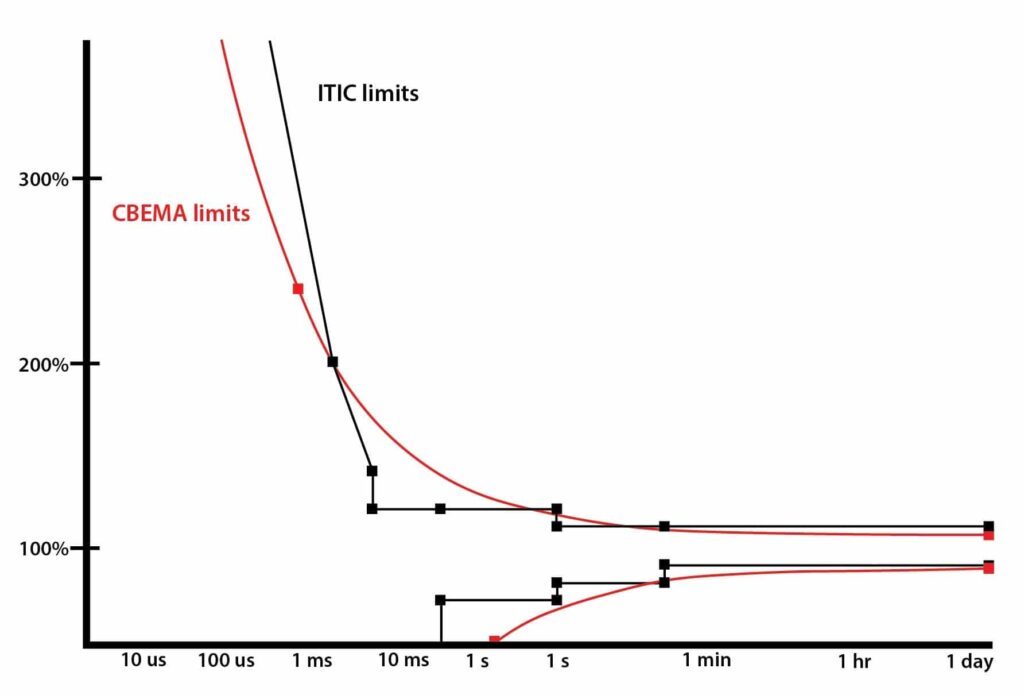
CBEMA defined its envelope using continuous curves, whereas the ITIC Curve is paradoxically defined in piecewise linear segments, making it computationally simpler to operationalize and little different in value. The curves represent a standardized model of the supply voltage operational envelope under which IT equipment is expected to “perform,” more on which later. The vertical axis represents the percentage above or below nominal voltage during an event, the duration of which is plotted on the horizontal axis. The normal operational envelope is on the left side of the limit lines; the right side, whether upward or downward, are the zones under which abnormal operation may be expected.
As can be seen, the sag and swell curves are essentially asymptotic to within +/- 10% of nominal; IT equipment is expected to operate continuously and indefinitely (within the equipment’s intrinsic limitations) subject to minor voltage variations of any duration. For events between 0.5 s and 10 s duration, equipment should normally perform, provided supply voltage is within +10 % /- 20% of nominal. Continuous operation with larger sags and swells is expected as the event time duration decreases. Advanced processing can determine the source of disturbances, whether utility or in-facility, further adding to sag and swell data’s diagnostic value.
Before we go further, it is essential to recognize what the ITIC curve is and what it isn’t. The ITIC curve is a simple, useful, and widely understood way of visualizing and classifying sags and swells and seeing the cumulative range and number of events that an individual piece of equipment or facility is subject to; Powerside’s PQube Report Writer software accomplishes precisely that. The ITIC curve is often specified for IT equipment, as one would expect. One thing to remember is that, while a wide range of equipment has similar properties to IT equipment, being built of similar components, the design considerations for the equipment and the application, and the operating envelope, may be entirely different. So, no single ITIC-like curve is universally applicable, and indeed, there are many like standards for different industries, equipment, and geos. While the ITIC/CBEMA philosophy and graph are useful in many cases, there is no one-size-fits-all approach to equipment or system design, and ITIC-like curves are not design standards unless comprehensively specified.
Where this matters the most is in the typical labeling of the ITIC IT curve, which often shows a “no damage” region for extended sags below the limit and “prohibited region” for extended swells above the limit, which may result in equipment damage. The simple truth is that the desired behavior of Utilities, power sources, and equipment under stress is generally application- or location-specific. So the labeling of zones in a performance envelope is often much more nuanced than this.
A few examples serve to illustrate the point. In some industries, it may be acceptable for equipment to recover from extended sags below the limits gracefully… liquid pumping or material processing, for example, where only quantity and not quality is lost from an event. Contrariwise, in semiconductor manufacturing, or plastic molding, extended sags or swells may result in process nonuniformity or process-window deviations, where the best-case outcome may be that the equipment gracefully enters a standby mode, or in worst case makes a full restart and ejects scrap material. There is also the case of potential equipment stalling in machine processing or of vacuum or cooling loss, where a protective shutdown may be required to avoid overheating or a costly restart.
In the case of extended swells, high-value equipment such as Variable Speed Drives may have an overvoltage trip to prevent damage when operated with supply voltage over 110% of nominal, even within ITIC limits. On the other hand, even surprisingly expensive consumer electronics may instead be designed with a sacrificial weak-link component, which by design fails safely in a sustained overvoltage, leaving the equipment irreparably damaged. To repeat, there is no single equipment performance specification based on an “ITIC-like curve” unless the curve and the required behavior is fully defined.
So, three cheers for the ITIC chart and curve! Correctly interpreted, it’s a powerful way of visualizing the range and quantity of voltage disturbances that a plant or equipment is subject to and assessing each event’s severity. It can lead to pivotal decisions about the need for and type of corrective action required. The IT-centric ITIC curve is a helpful preliminary guideline but not a standard when assessing the performance of both Utilities and plants in a wide range of applications.