 Skip to the content
From emerging reliance on decentralized and inverter-based technologies to the increasing demand for electrification of new types of loads, the evolution of the power grid is introducing real challenges to grid stability. Grid operators must adapt, requiring more granular and timely data to enable analytics that improve efficiency and support proactive mitigation strategies.
When it comes to analytics platforms, the balance between cyber risk and reward often pushes utilities toward either on-premise or cloud-based options—seen as a choice between locked-down systems versus system-learning, cloud-enabled architectures that enable real-time, proactive maintenance.
However, this decision doesn’t need to be binary or dictated solely by IT risk policies.
The benefits of modern analytics are too significant to ignore. At Powerside, we believe both approaches have merit and can coexist.
Maintaining reliability during blue-sky days and resiliency during black-sky days is more relevant than ever in a rapidly changing grid. Moving from reactive to proactive operations is key to improving grid resilience.
Here, we’ll explore how we can help you securely and effectively use data with the best of both on-premise and cloud-based power quality solutions.
Why Choose Power Quality Monitoring Over Smart Metering?
First, let’s define power quality, which is the influence voltage and current anomalies have on end-use equipment.
- Good power quality supports electrical health, ensuring operational stability and equipment efficiency.
- Poor power quality occurs when disturbances interfere with normal operation, causing deviations from the fundamental sine wave. These include voltage sags, swells, harmonics, high-frequency transients and imbalance.
Power quality monitoring devices provide high-fidelity data that uncovers electrical issues often missed by traditional metering systems. Typically aligned with IEC 61000-4-30 Ed3 standards, power quality monitors capture high-resolution measurements.
In contrast, standard metering—while accurate—operates at lower sampling rates and cannot detect short-duration transients or distortions common in modern inverter-based networks. For this reason, smart metering is useful for general power consumption trending, but it lacks the depth required for root cause analysis of power quality events.
The Goals & Standards of Power Quality Monitoring at Utilities
Utilities typically deploy power quality monitors to gain continuous visibility into grid conditions without requiring physical, on-site field measurement campaigns. Reactive, temporary monitoring campaigns are costly and provide limited insight in a dynamic grid environment. So, permanent power quality analyzers have traditionally been installed at feeder sources or substations. Today, deployment has expanded to critical customers downline, like data centers, hospitals and renewable energy sites, as well as generation sources and grid-edge locations.
To level the vendor playing field and improve data visibility, utilities have created standards for power quality data formats and file transfers across multiple monitoring hardware devices. Namely, PQDIF (Power Quality Data Interchange Format) and COMTRADE (Common Format for Transient Data Exchange) are used in common on-premise platforms to manage and consolidate data across different vendor devices.
Now, the challenge is no longer data availability, but a shortage of timely, actionable data insights.
Many cloud-based analytics platforms—including QubeScan Monitoring and Analysis Software—offer strong fleet management, signature recognition and trend analysis, but are often limited to specific OEM hardware. This is where one especially powerful PQDMS (Power Quality Data Management System), the PQView4 platform, adds immense value.
PQView® from Powerside enables users to collect, visualize and analyze data from multiple sensors across the network. Combined with fault location, compliance reporting and remote access, it provides a powerful suite of tools for visibility and analytics within customer networks. Moving forward, our vision is to add to these capabilities with secure accessibility outside the network, as well.
Trends in Accessibility, Fleet Management & Analytics
Bridging the gap between multi-instrument data integration and secure, real-time fleet analytics is now possible without compromising system security.
With this visibility, utilities can establish baseline conditions across their fleet and set alerts when performance deviates from normal operating conditions. These insights can then be routed directly to engineering teams familiar with power quality issues for troubleshooting.
Power quality monitoring is increasingly used for compliance verification (e.g., IEEE 519-2022 for harmonics). Enhanced visibility accelerates issue diagnosis, trend detection and identification of grid design limitations.
At scale, manually reviewing each monitoring site is impractical. Automated analysis and event notifications are essential, enabling engineers to focus on critical issues rather than browsing through data. Applications include compliance verification, SARFI categorization, event tracking, and sustained issue detection (e.g., voltage imbalance exceeding thresholds over time).
Power Quality Disturbances & Predictive Maintenance Benefits
The value of secure, real-time power quality data to utility networks must be supported by real examples and system benefits. Because data visibility alone isn’t enough without actionable insights.
So, what have we seen with enabled high-resolution systems with advanced analytics capabilities?
Case #1: Transients and High-Frequency Impulse Detection for Pre-Fault Analysis
A utility using primary metering VTs interfacing with our Class A power quality monitor set the high frequency (HF) impulse trigger to a sensitive threshold. Over time, the electrical behavior of the site changed, with a high volume of intermittent HF impulse events observed over a brief period (Fig. 1).
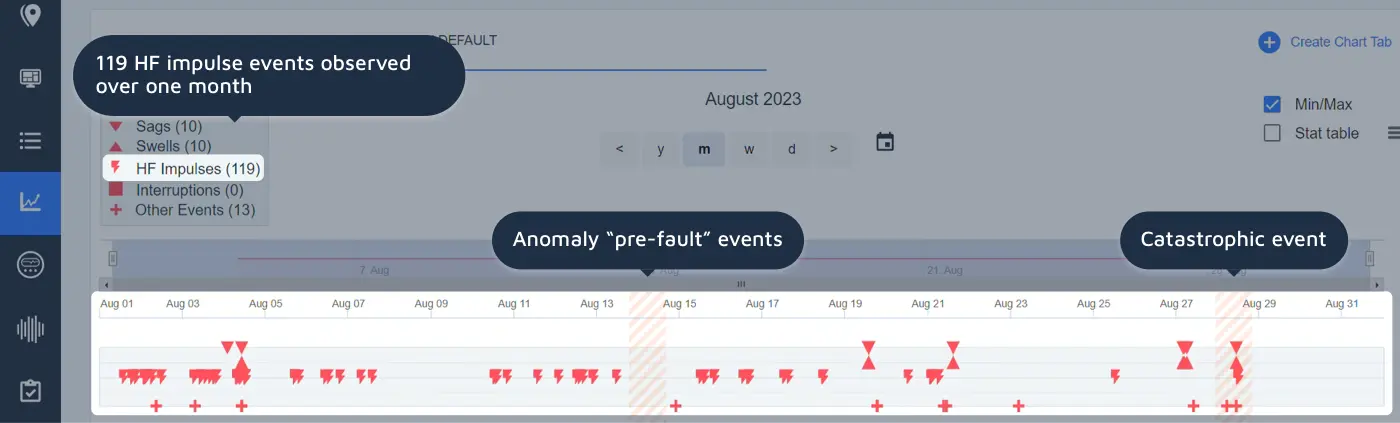
Figure 1: Over one month, the electrical behavior of the site changed dramatically
The voltage signature was consistently low in magnitude, oscillatory in nature and on the same phase. As a result, one site suffered a catastrophic failure on the voltage transformer.
Meanwhile, a recurring event pattern was recognized within the utility at a second site (Fig. 2), subsequently triggering proactive replacement of the voltage transformer equipment. This time, similar behavior avoided major loss costs.
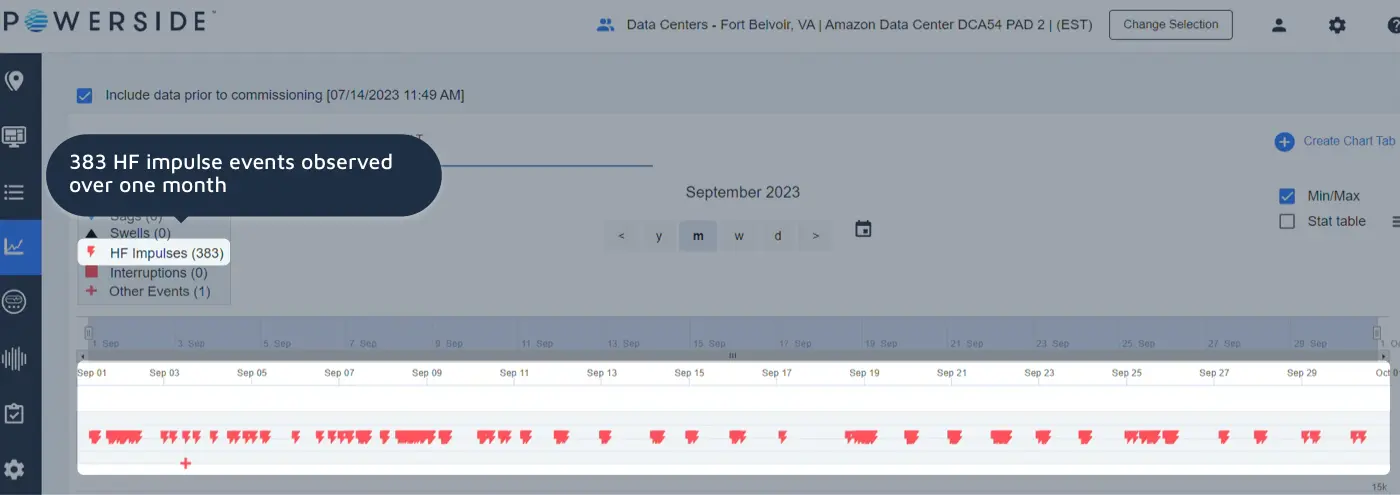
Figure 2: HF impulse “pre-fault” events prompting proactive maintenance
Proper analysis of the trended incidence (Fig. 3) allowed a progression learning model to normalize urgency and development of the issue.
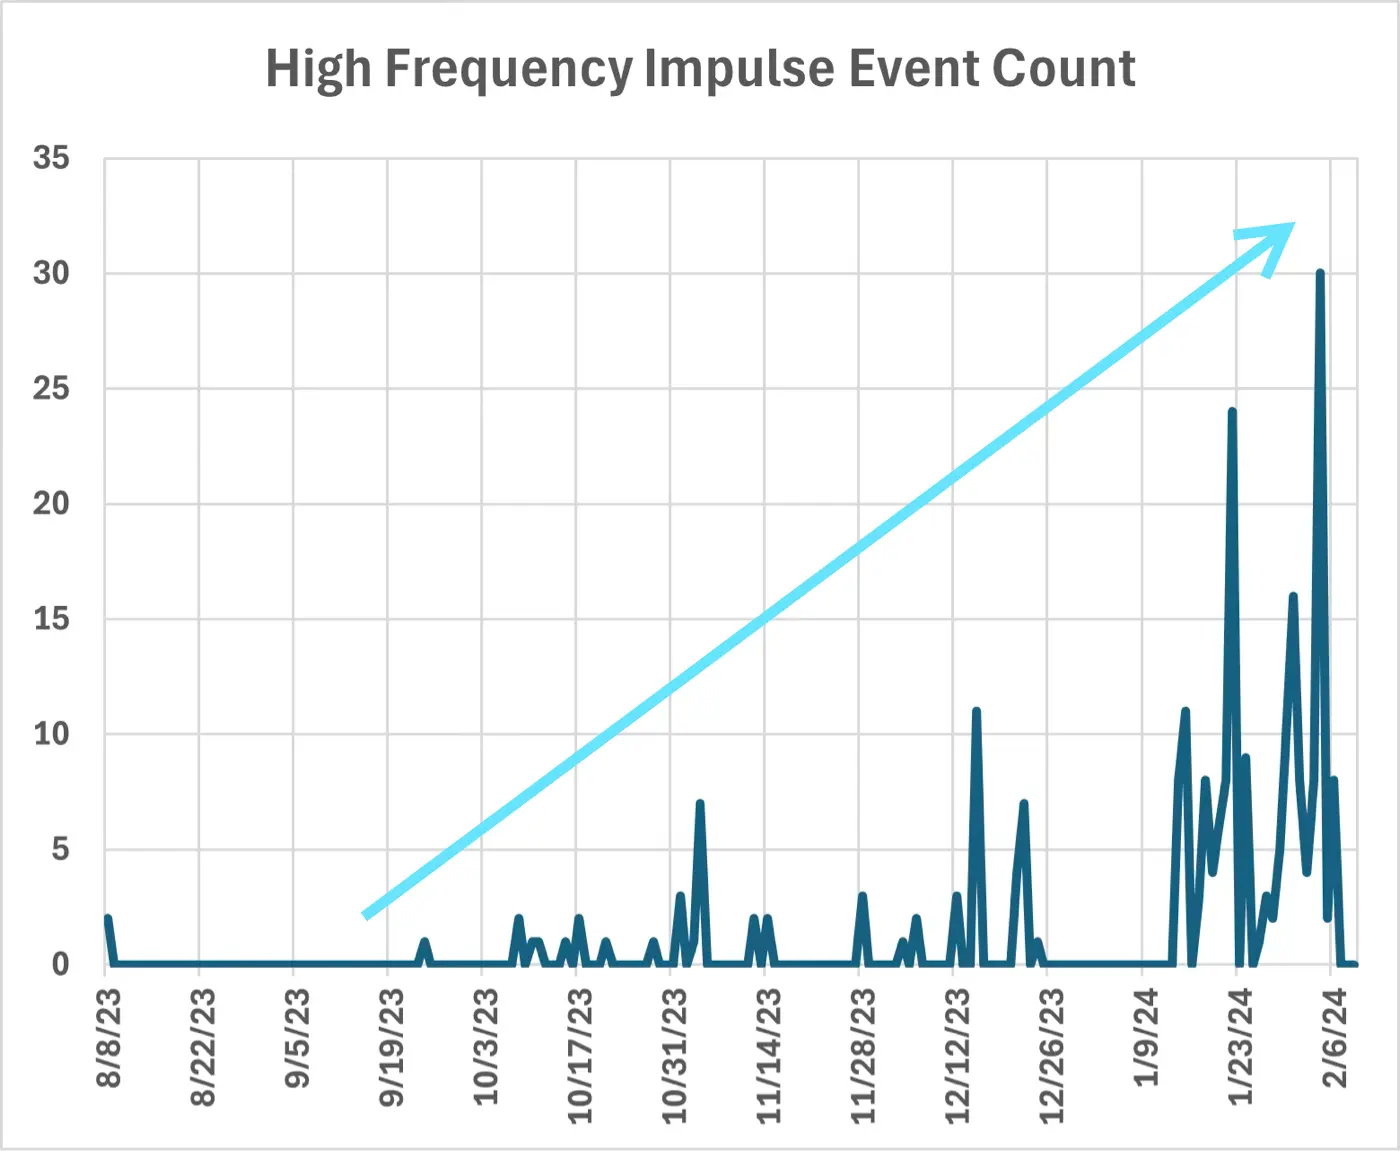
Figure 3: HF impulse event count over time
Case #2: Harmonics and Compliance Reporting in Active Grid Assessment
Harmonics—generated by non-linear loads such as rectifiers, VFDs and inverter-based resources—are increasingly prevalent. However, compliance assessments are often reactive and triggered by complaints.
Such was the case with a high-order harmonic disturbance from a utility-scale solar application. A residential customer reported to their local utility malfunctioning lighting, CFGIs and appliance issues, particularly on sunny days.
The utility visited the site, confirmed the reported behavior (Fig. 4) and consulted with Powerside Engineering Services for further, power quality–focused assistance. We installed a permanently mounted power quality monitor at the solar farm’s point of interconnection (PQI), providing the necessary data to diagnose the issue.
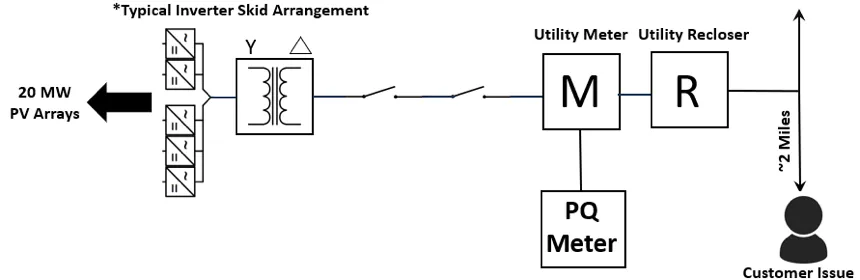
Figure 4: Harmonics case study single line diagram
Analysis showed no violations in flicker (IEEE 1453) or traditional harmonics (IEEE 519). However, HF conducted emissions (supraharmonics) were present, particularly at 3.4kHz, 10kHz and 12kHz. These emissions were traced to inverter switching frequencies. When the solar farm was isolated, the distortion ceased and customer issues resolved. The inverter manufacturer mitigated the issue by adjusting switching frequencies, reducing distortion levels.
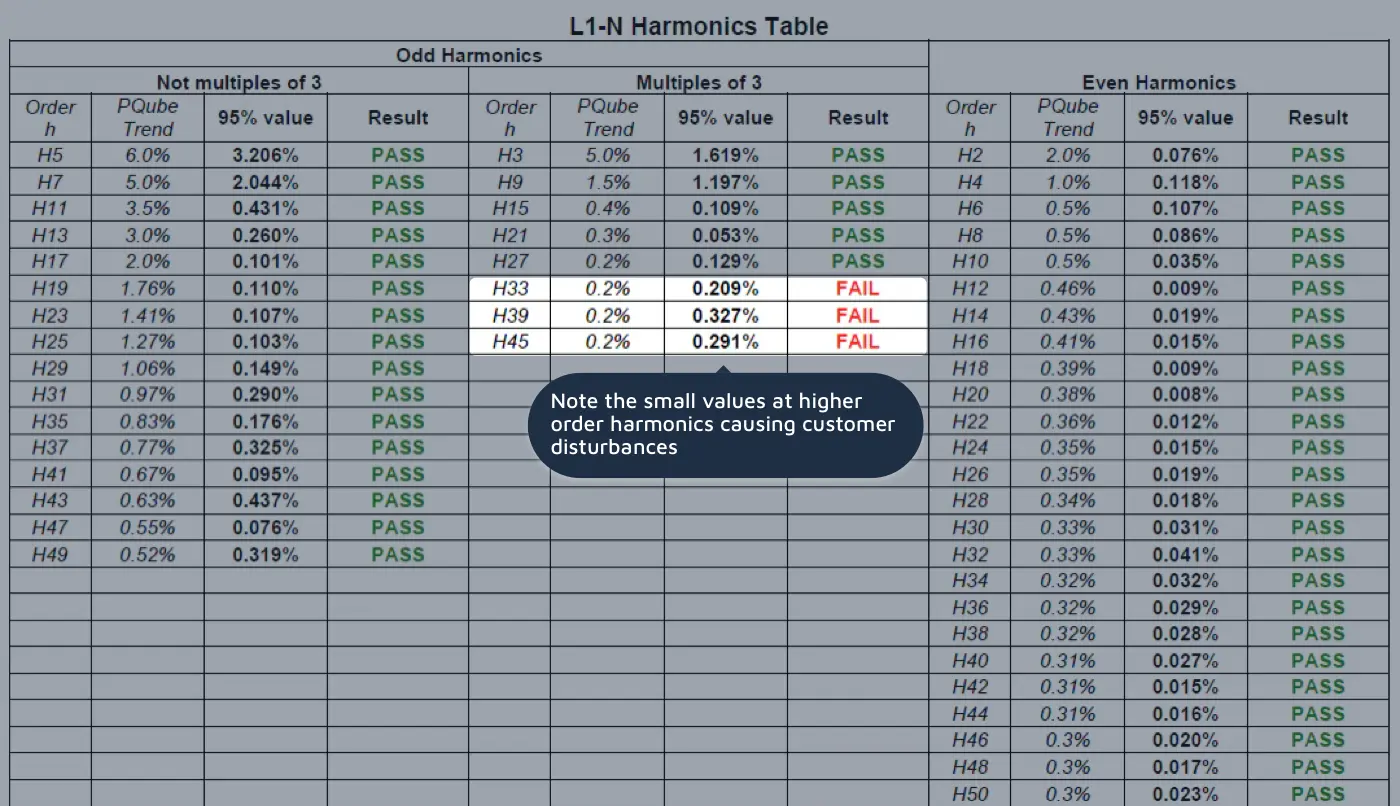
Figure 5: Voltage harmonics compliance chart (H33, H39, H45 non-compliant on Phase 1)
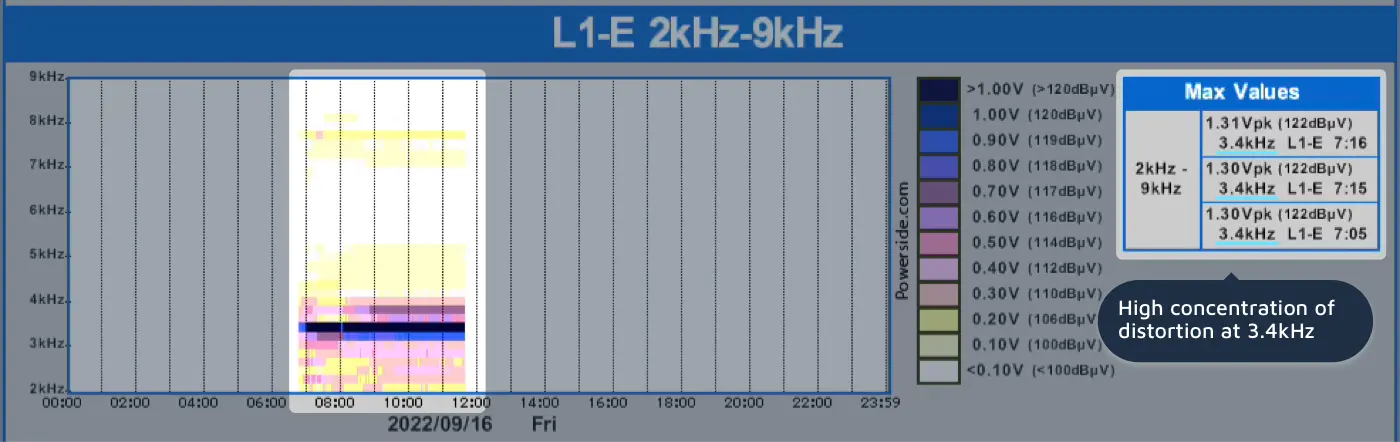
Figure 6: Heat map of conducted emissions 2–9kHz (high distortion in 3.4kHz band)
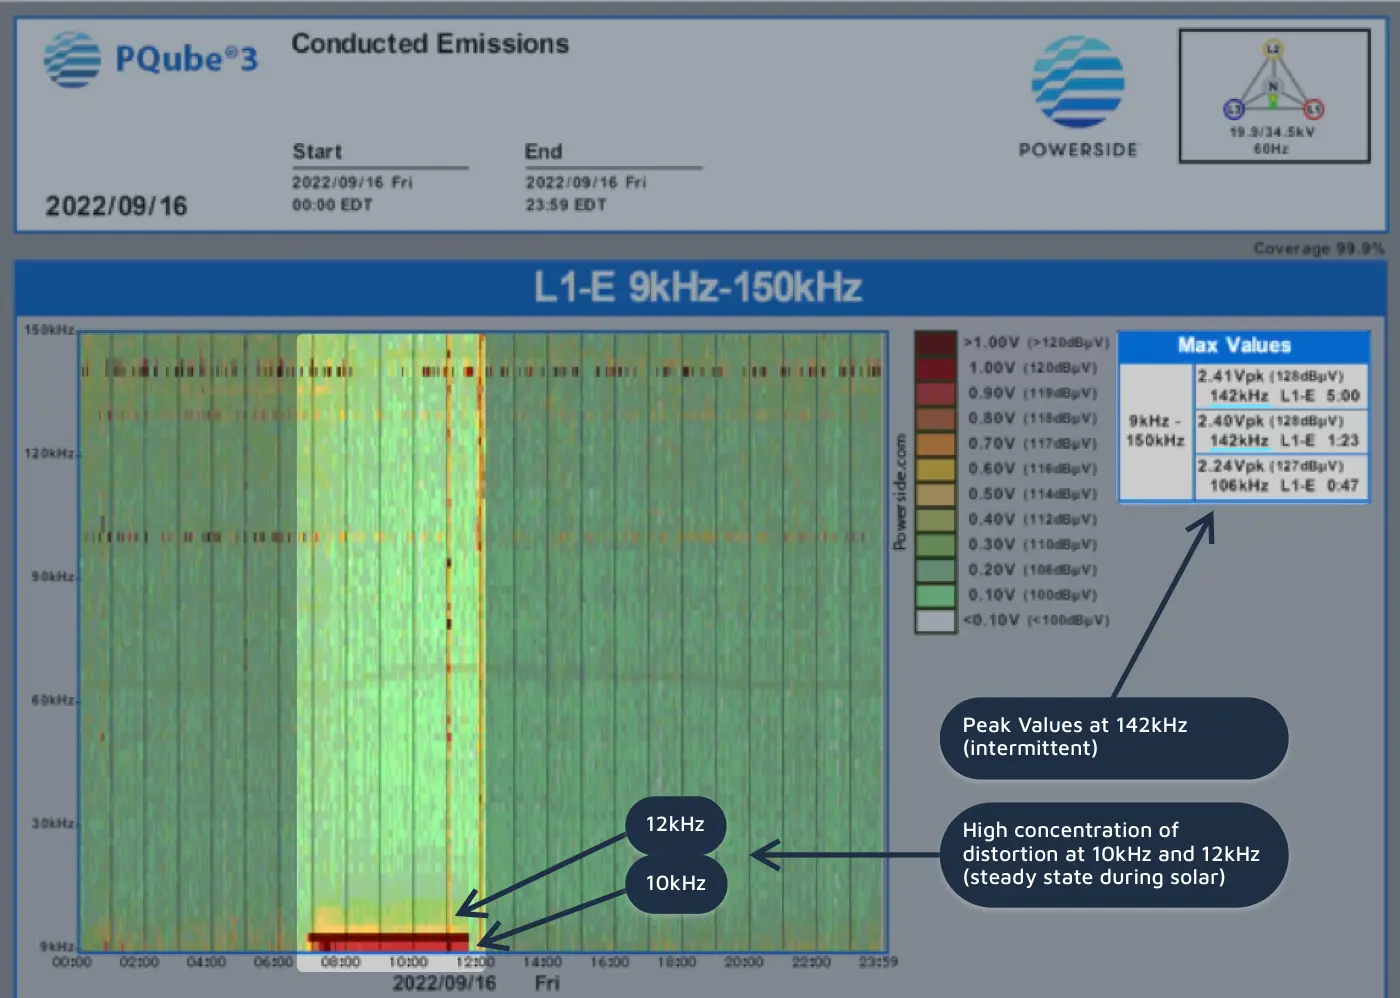
Figure 7: Heat map of conducted emissions 9–150kHz (high steady state distortion at 10kHz and 12kHz)
Looking Forward: Proactively Addressing Emerging Power Quality Issues
As power system infrastructure and equipment continues to age and evolve, there are opportunities to get ahead of developing electrical problems with advanced tools that provide actionable, proactive information. High-fidelity Class A power quality monitors are most effective when combined with complementary devices and robust analytics platforms.
Interconnection and real-time analytics enable power quality experts to act proactively, while continuous fleet monitoring and compliance reporting at critical locations provide the insights needed to prevent issues before they escalate into costly outages.
The risk-reward balance ultimately depends on how and where data is hosted. While cloud connectivity as a point-to-point connection can introduce concerns for separate power quality devices, integrating secure communications with established on-premise systems reduces exposure while unlocking powerful, vendor-agnostic data analytics. It also opens the door to automated PQ signature recognition using AI and machine learning techniques.
Powerside offers a tailored, secure approach that combines the strengths of both on-premise and cloud solutions—delivering the best of both worlds.
As the industry moves forward, access to high-fidelity, timely and intuitive data will be critical to understanding grid health. These capabilities are essential to achieving the reliability and resilience demanded by today’s dynamic grid.
Get proactive today. Explore Powerside’s data-driven solutions to stay ahead of power quality in a dynamic grid.