Skip to the content
PQView® Data Concentrator & Analysis Software
Uncover Potential Power Problems Using a State-of-the-Art Software Solution
PQView® is an enterprise power quality data concentrator and analyzer used by more than 80 utilities across five continents. This device-agnostic, on-premise software transforms the way our customers work, acquiring and storing data from all power monitoring devices and systems to provide powerful, real-time visibility and analytics on one single software tool. And with ongoing software maintenance and three editions available, there’s a PQView to meet the needs and requirements of any application or use case.
PQView Industry Applications
Robust Power Quality Analysis
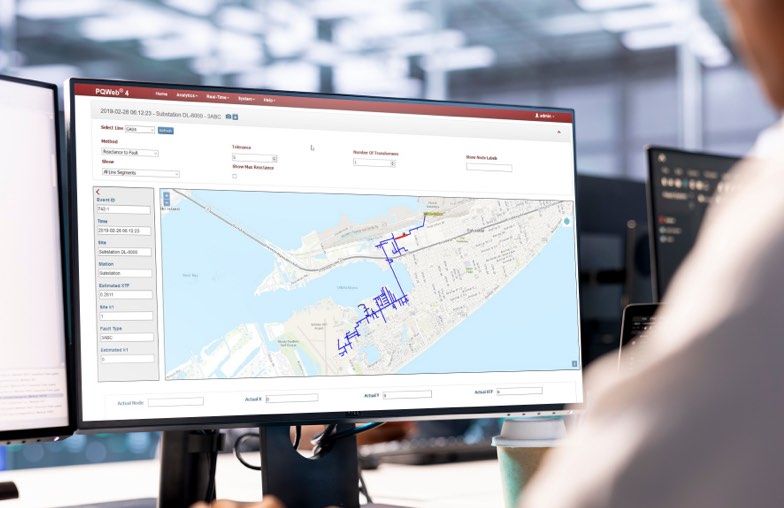
Gain quick insights into power quality health with user-friendly dashboards, data & event logs, RMS variations and waveform analysis.
Multi-Data Source Integration
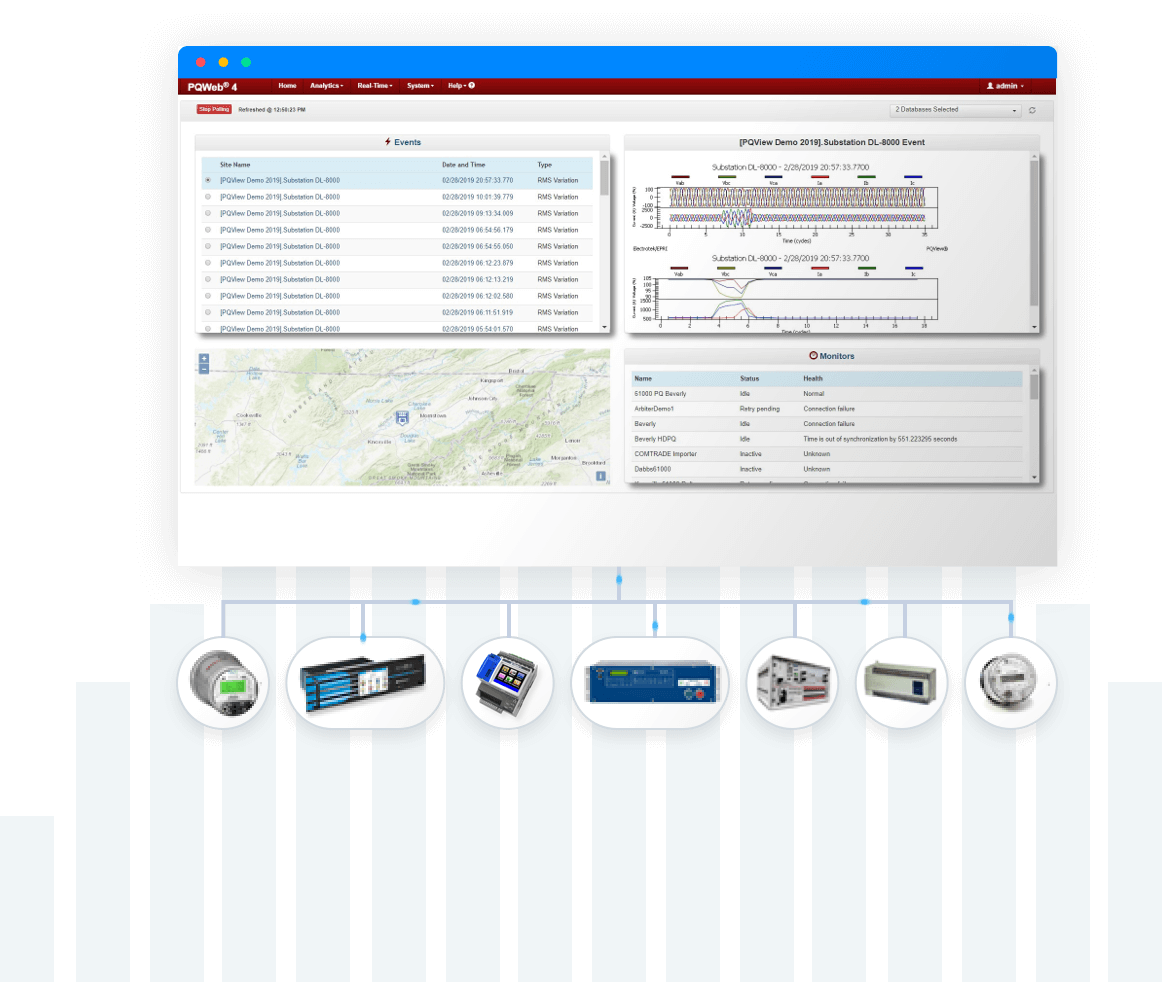
Enterprise companies needing to collate information from multiple data sources can use the device-agnostic PQView. Integrate data from multiple types of power analyzers or smart meters, databases or systems (SCADA, OMS), and industry-standard files (IEEE COMTRADE, IEEE PQDIF) to holistically evaluate your power quality — all in one system.

Security-Forward Software
PQView is an on-premise software that runs within your own physical environment. Control your levels of security, compliance, data and infrastructure without worries of external factors.
PQView Key Benefits

Comprehensive User Interface
Leverage powerful web-based graphical interfaces and analytics tools including user-friendly dashboards, power quality analysis tools, reporting tools and fault location.

Multiple Data Source Incorporation
PQView's Power Quality Data Manager Service (PQDMS) is a data concentrator that allows for direct communication with — and data retrieval from — many popular measurement devices and systems.

Understandable Data
With static, interactive and derived charts, present your data in digestible formats to gain clear insights on your power quality performance.

Maximum Flexibility
Install PQView software on a single server or across multiple machines as needed.

Service/Server-Based Architecture
PQView runs unattended to import data, dispatch notifications and serve up data and analytics as needed.

Maximum Flexibility
Install PQView software on a single server or across multiple machines as needed.
PQView System Integrations
PQView is device-agnostic and can therefore integrate with a variety of data sources. These data sources cover power analyzers, smart meters, databases or systems and industry-standard files.
Integration Features:
- Fleet Management: Monitor multiple units from a single dashboard
- Third-Party Compatibility: IEC 61850 IED Interface, MODBUS Protocol, IEEE Std 1159.3-2019 PQDIF files, IEEE Std C37.111-1991/1999 COMTRADE files
PQView Specifications
| Parameter | Specification |
|---|---|
| Supported Devices |
Advantech® Corporation ADAM Analog and Digital Modules AMETEK JemStar II Monitor Arbiter® Systems Power Sentinal 1133A
Camille Bauer PQ3000, PQ5000, SINEAX A230, A230S, A220, A210 Dranetz HDPQ-DN, HDPQ, HDPQ Plus, HDPQ SP, 61000, 5530, PQ3K, PQ5K, ES210, ES220, ES230, ES230s ElectroIndustries Nexus 1500, Shark 200 via PQDIF export
IEC 61850 IED Interface Iskra MC-784 Gossen Metrawatt Mavosys 10, Mavolog Pro
MODBUS® Protocol OSIsoft® PI System
Power Standards Lab® PQube® Classic, PQube® 3 PMI CANVASS Website Rockwell Automation I-Grid Website SATEC PM-170, PM-174, PM-180 Schneider Electric® ION® devices, Schneider Electric® PME Database Schweitzer Engineering Laboratories® Relays, Reclosers and Power Quality Monitors Schweitzer Engineering Laboratories® Compressed Event Reports (CEV files) and Load Profile Reports (LDP files) IEEE® Std 1159.3-2019 PQDIF files, IEEE® Std C37.111-1991/1999 COMTRADE files
|
| Available Charts |
Static Charts, Interactive Charts, Derived Charts
|
| Chart Categories |
Voltage/Current Waveform Analysis, RMS Variation Analysis, Fault Analysis, Data Logs
|
| Voltage and Current Analysis via Derived Charts |
Spectrum from 1-Cycle Window, Spectrum from N-Cycle Window, Phasors, Spectrum and Phasors
|
| Data Filters |
High Pass Filter (HPF), Low Pass Filter (LPF), Custom Filter Derived Charts, Mean Value Derived Chart, Form Factor Derived Charts, Load Resistance Derived Chart
|
Downloads, Documentation and Help
PQView is extremely beneficial for any industry needing robust power quality analysis or dealing with a large network of data sources, including:
PQView’s Automatic Reporting System (ARS) and Power Quality Data Reporting (PQDR) allow for customizable and automatic reports summarizing power quality monitoring campaigns or summarizing compliance with IEEE 519 and EN 50160. Test 2
The charts are available for voltage/current waveform analysis, RMS variation analysis, fault analysis and data logs. You can also apply filters to your data, such as high pass and low pass filters.
PQView has integration options with intelligent devices (meters, relays, RTUs, power quality analyzers, fault recorders), databases or systems (SCADA, OMS, DMS, MDMS, AMR, Historian, Weather) and industry-standard files (IEEE COMTRADE, IEEE PQDIF).
PQView has direct download capabilities with monitoring devices from Advantech, AMETEK, Arbiter, Camille Bauer, Dranetz, ElectroIndustries, IEC 61850 IED Interface, Iskra, Gossen, MODBUS Protocol, OSIsoft, Power Standards Lab, PMI CANVASS, Rockwell Automation, SATEC, Schneider Electric, Schweitzer Engineering Laboratories and IEEE PQDIF and COMTRADE files.
Robust Analytics & Reporting, Regardless of Device
PQView is the analysis tool that provides power quality analysis, dashboards, reporting and fault location through its built-in FaultPoint function. It’s device-agnostic and can integrate data from a number of sources, including power quality analyzers like Powerside’s PQube® 3, as well as digital relays, fault recorders, smart meters and SCADA systems. PQView also works seamlessly with analytical tools that convert raw data into helpful insights, such as:
- Dashboards
- Power quality analysis tools
- Reporting too
- Fault location
Locally Installed & Tailored to Your Needs
As an on-premise software solution, PQView is run within your own physical environment, rather than remotely. This means customizable levels of security and compliance, unique data and infrastructure control and fewer dependencies on external factors — for you and your customers. Plus, easily cross-reference data with other information without having to install a variety of software.
Leverage Advanced Visualization & Automated Reporting
PQView combines powerful charting tools with automated reporting to simplify power quality analysis and compliance workflows. Generate static and interactive charts for waveform analysis, RMS variations, fault analysis and data logs, then export data into convenient formats like JPEG and PDF.
Integrated smartgrid reporting solutions support automated report generation, archiving and distribution across unlimited monitoring sites, with flexible customization and data processing capabilities. Features include:
Integrated smartgrid reporting solutions support automated report generation, archiving and distribution across unlimited monitoring sites, with flexible customization and data processing capabilities. Features include:
Voltage/current waveform analysis
Data log visualization
Custom filters & aggregation
Automated report generation & delivery
Flexible reporting
Harness the Power of PQView in a Web Browser
View PQView’s advanced analysis via derived charts in a web browser. Utilizing state-of-the-art web technology, PQWeb provides the best user experience possible via a fully interactive website. By automatically adjusting to the size of the screen and with HTML 5 and JavaScript interactivity, PQWeb provides a seamless user experience regardless of device or web browser used.
Software Interfaces Expand Scope
Although PQView is a complete and standalone system, software interfaces are available to expand the scope of PQView’s data to other systems, either by acquiring and combining data from other monitoring systems or by allowing other systems to access PQView data.
Development Kits Enable Custom Application Creation
PQView’s available Software Development Kits (SDK) allow you to create your own application around PQView. Each SDK includes supporting documentation and sample coding.
IEC 61850 IED
OSIsoft® PI System integration
PQWeb SDK
PQView Datalayer SDK
PQDMS HTTP API
PQView 4 SQL Interface SDK
The Static, Interactive, and Derived Charts for Your Power Quality Monitoring System
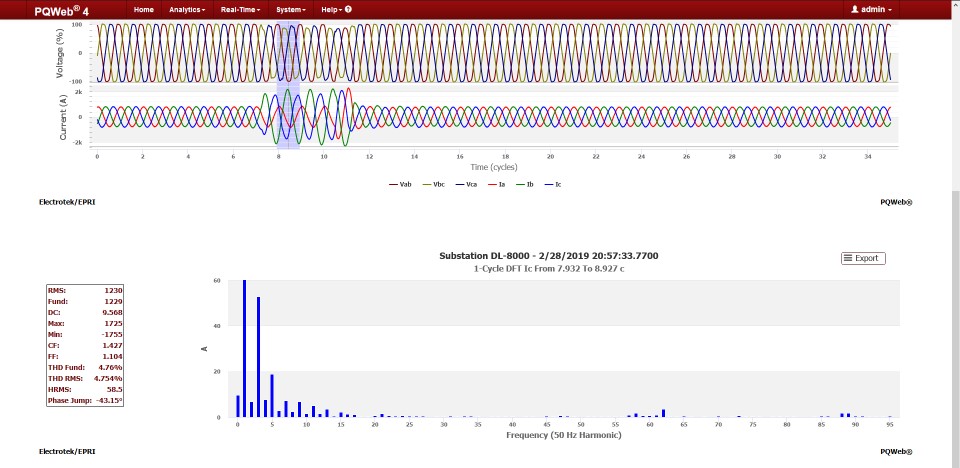
Spectrum from 1-Cycle Window
Provides 1-cycle window for analysis.
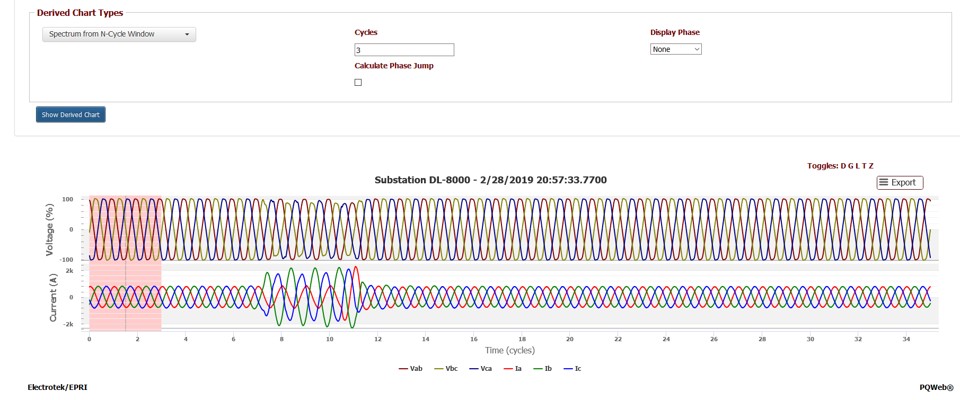
Spectrum from N-Cycle Window
Customize N-cycles on your spectrum chart.
Phasors
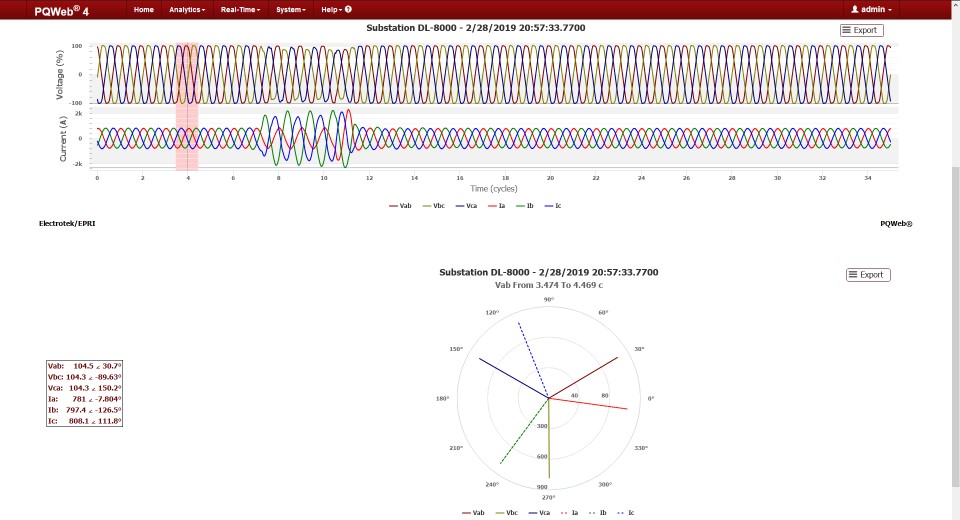
View voltage and current waveforms alongside their corresponding phasors. Previous
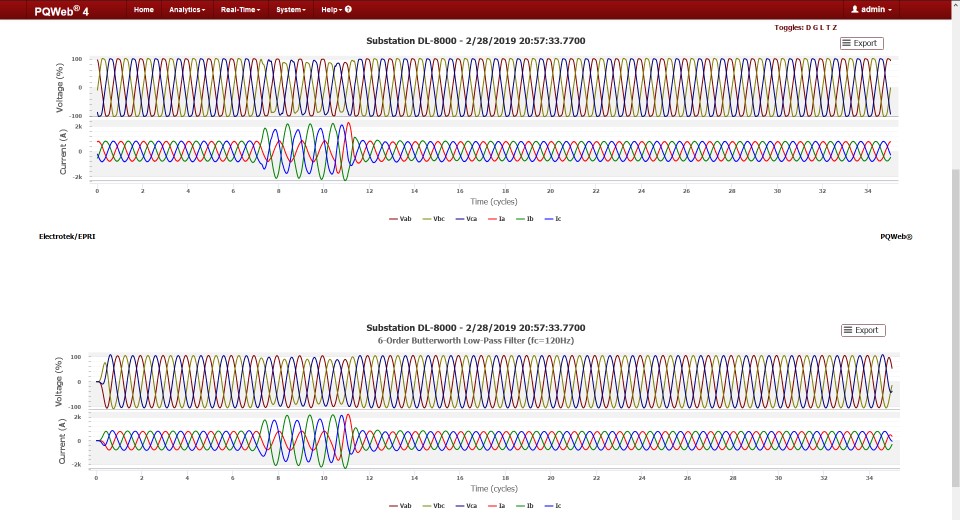
Spectrum and Phasors
See both spectrum and phasor views together for quicker analysis.
High Pass Filter (HPF)
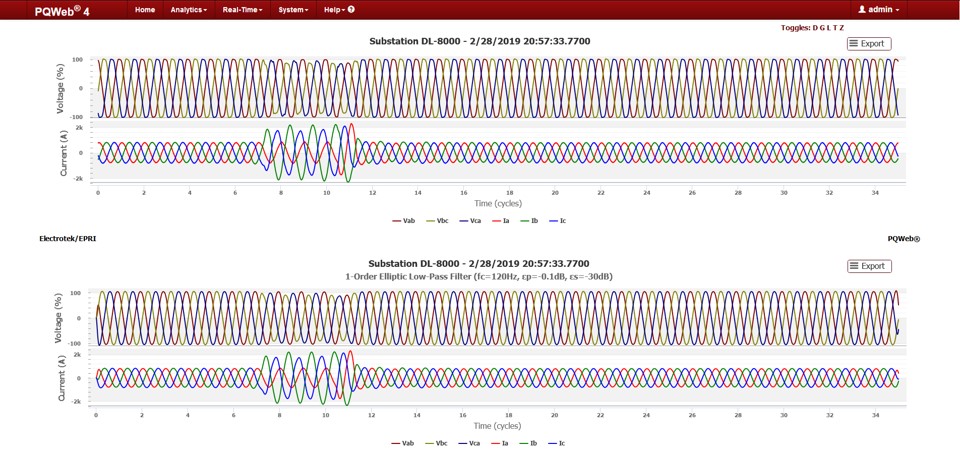
Low Pass Filter (LPF)
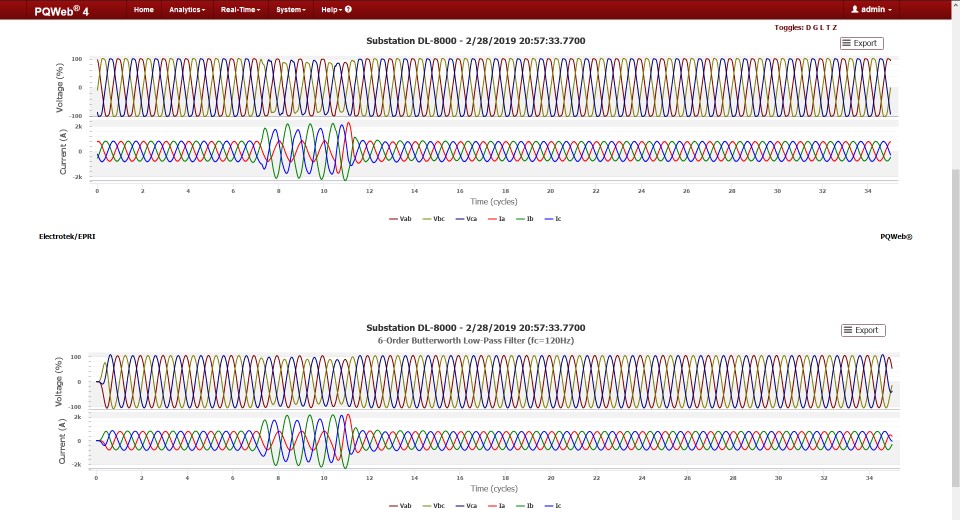
Custom Filter Derived Charts
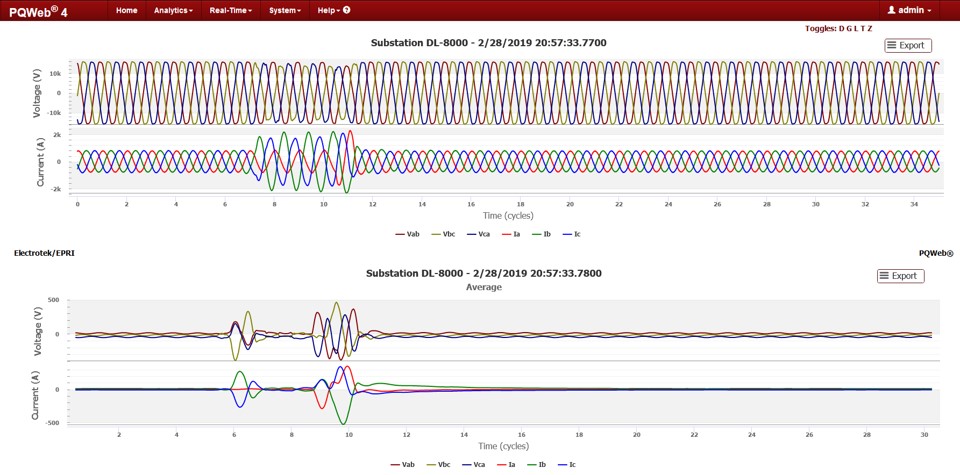
Mean Value Derived Chart
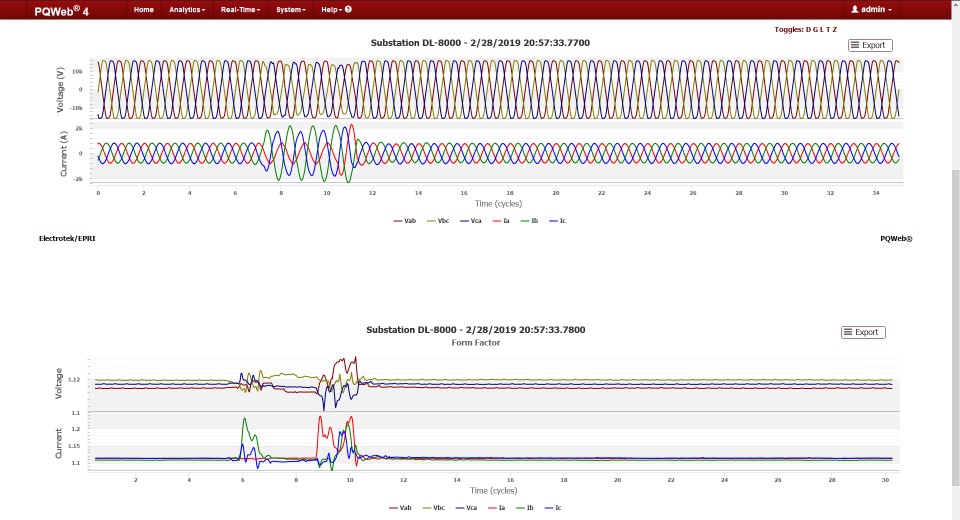
Form Factor Derived Charts
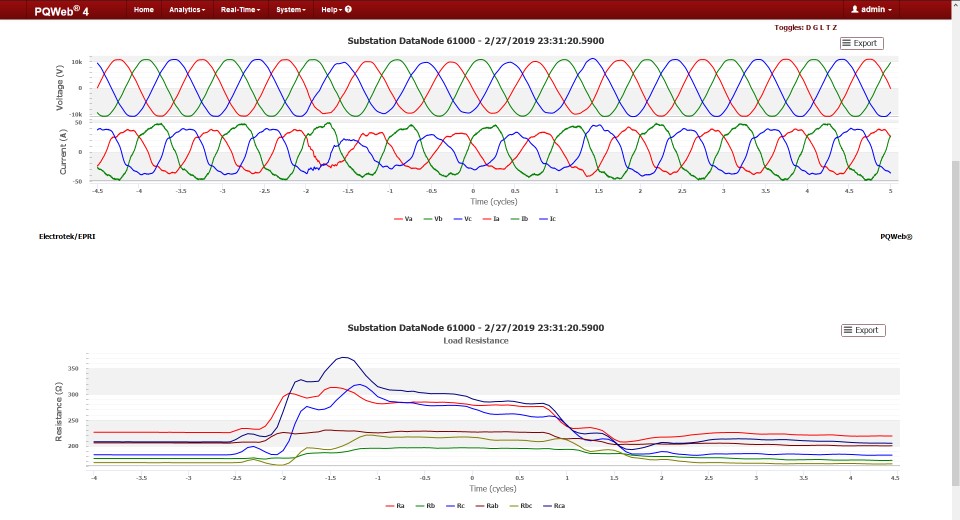
Load Resistance Derived Chart
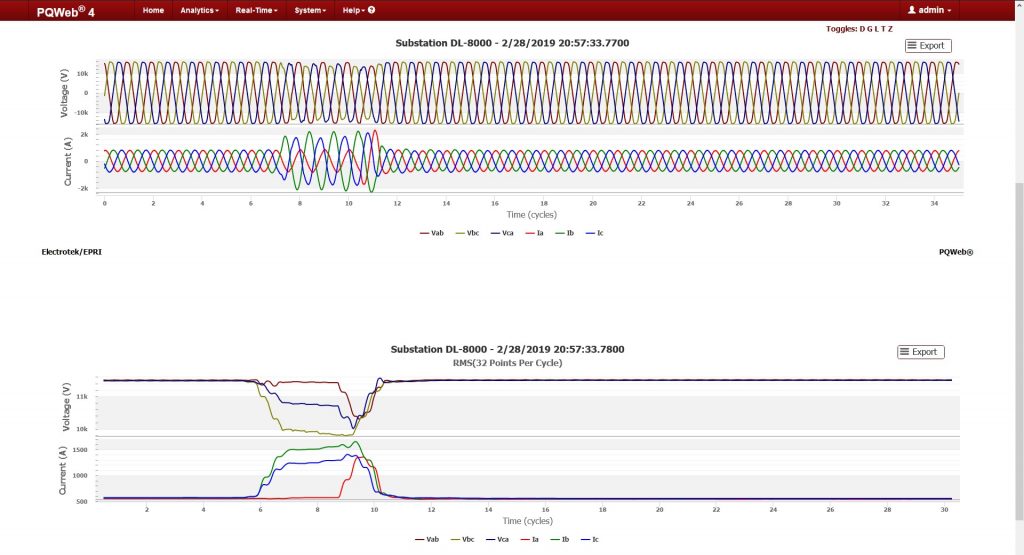
RMS Value Derived Chart
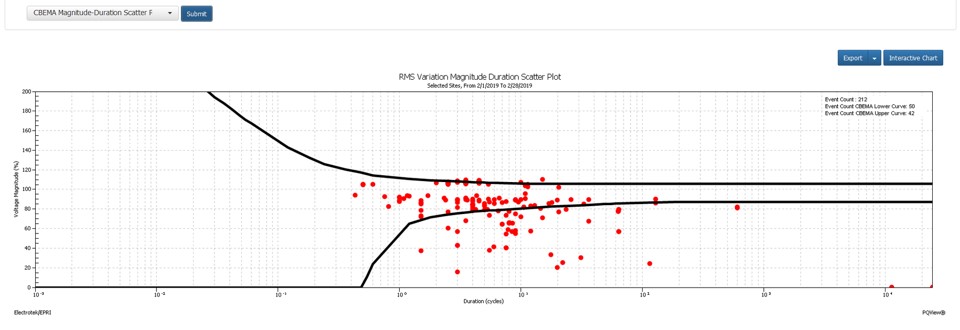
CBEMA Mag-Dur Plot
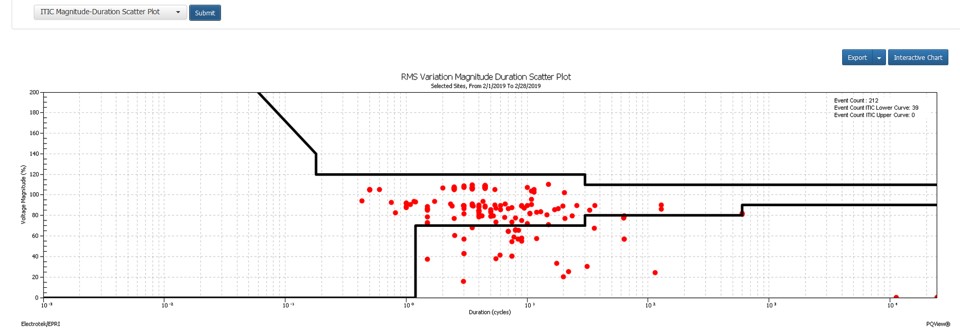
ITIC Mag-Dur Plot
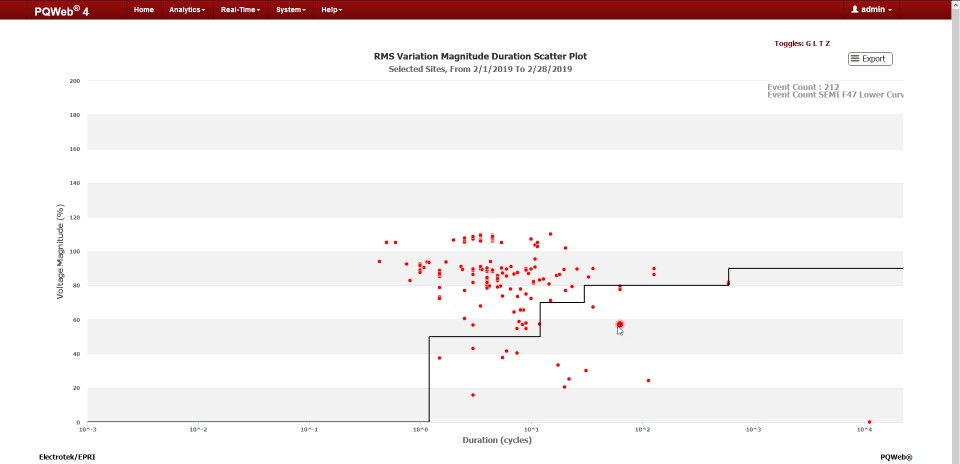
SEMI F47 Mag-Dur Plot
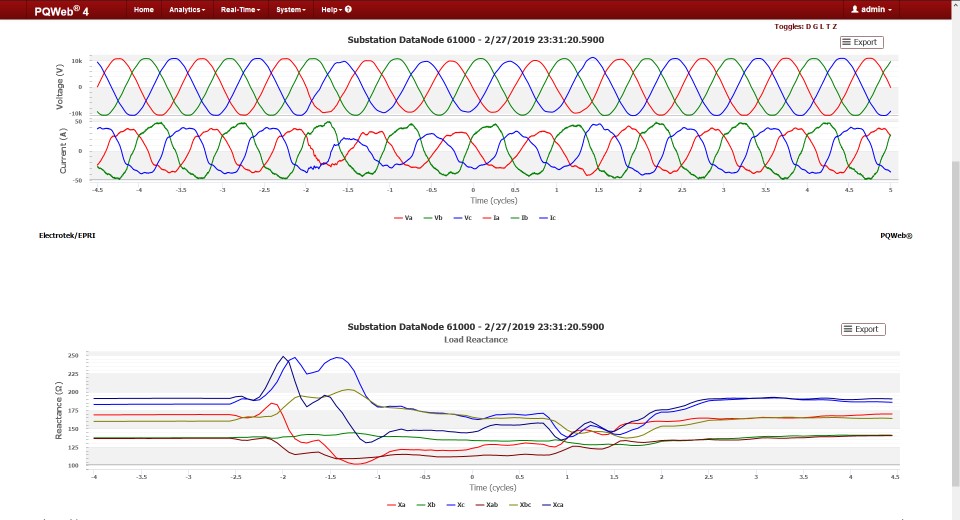
Load Reactance Derived Chart
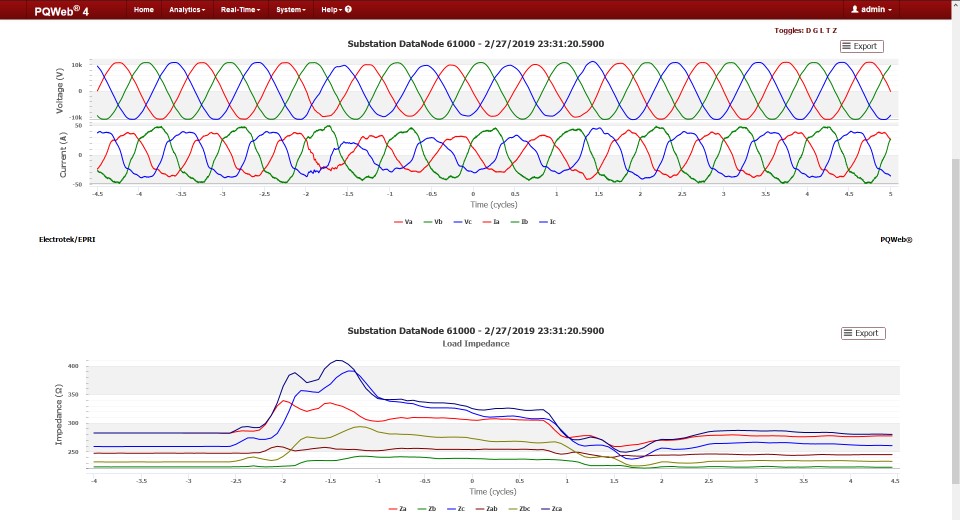
Load Impedance Derived Chart
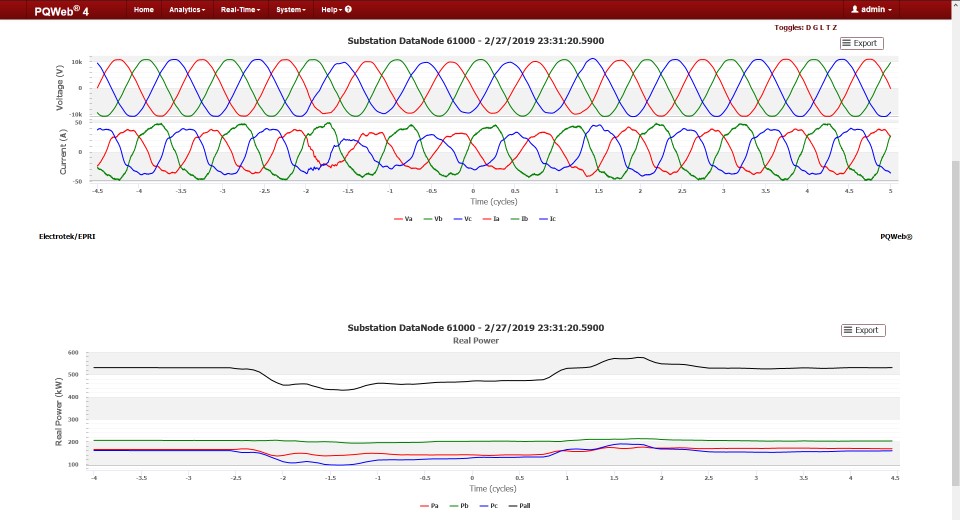
Real Power Derived Chart
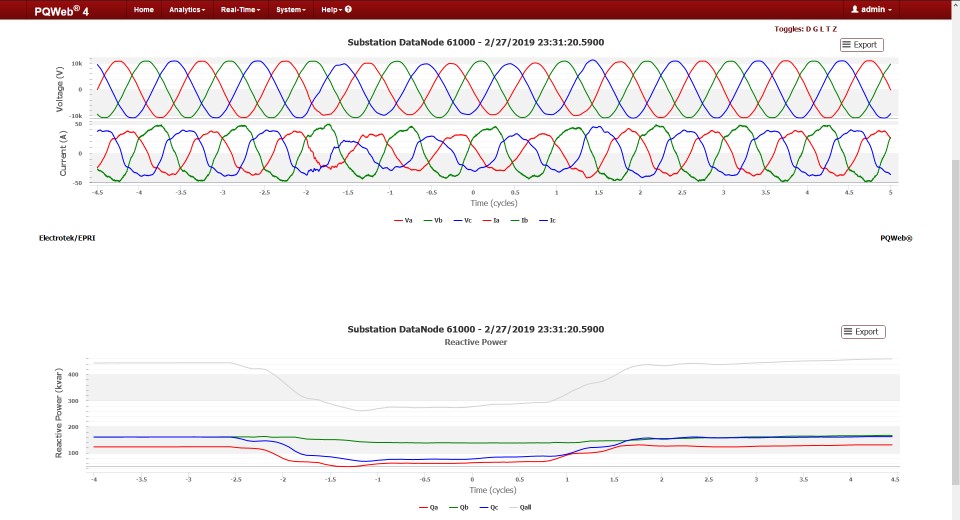
Reactive Power Derived Chart
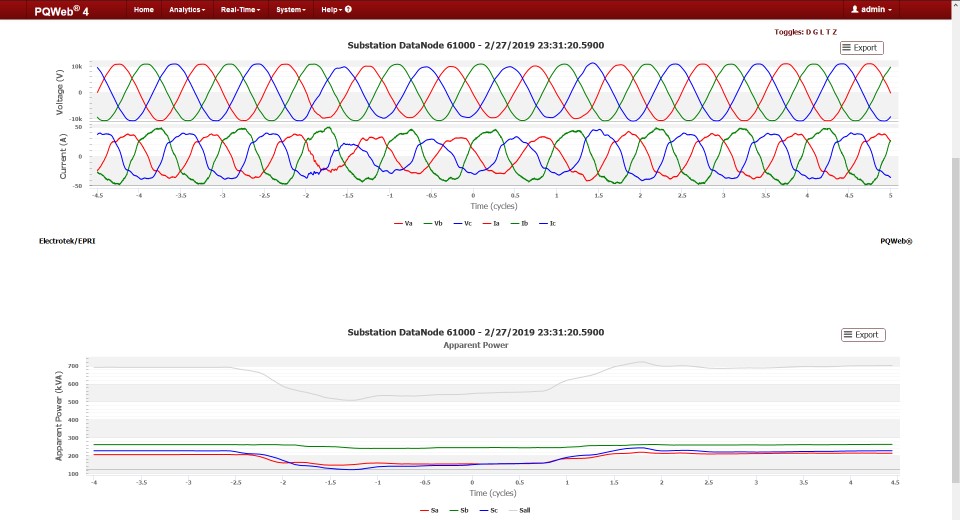
Apparent Power Derived Chart
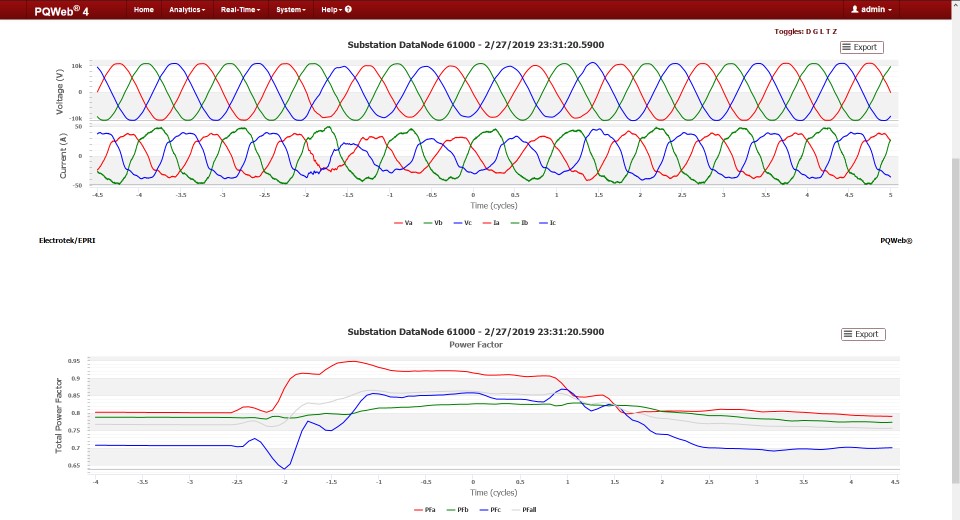
Power Factor Derived Chart
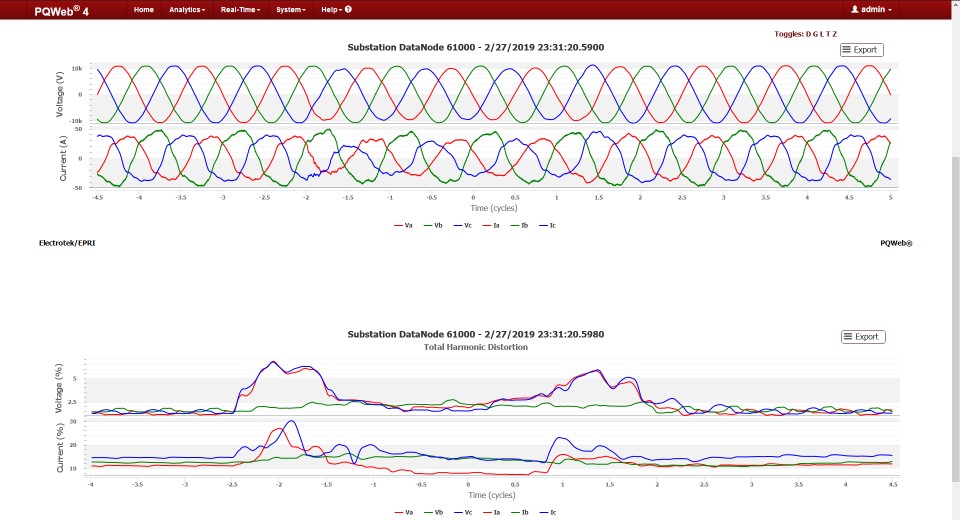
Total Harmonic Distortion Derived Chart
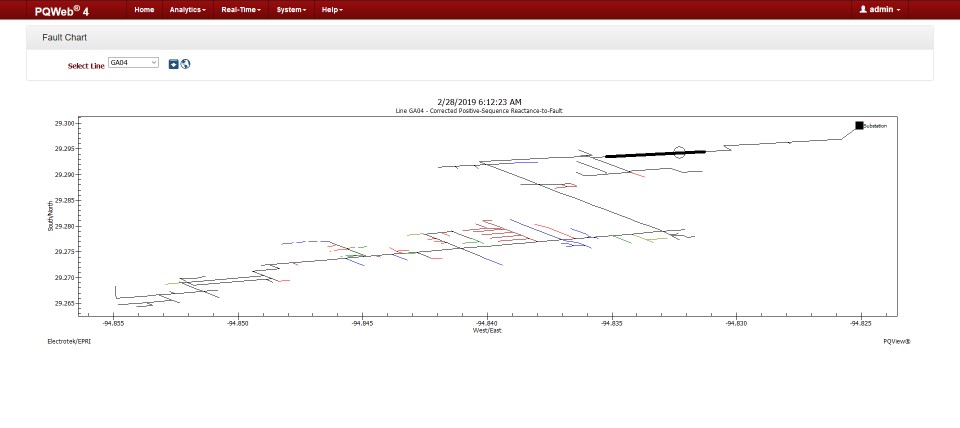
Fault Chart
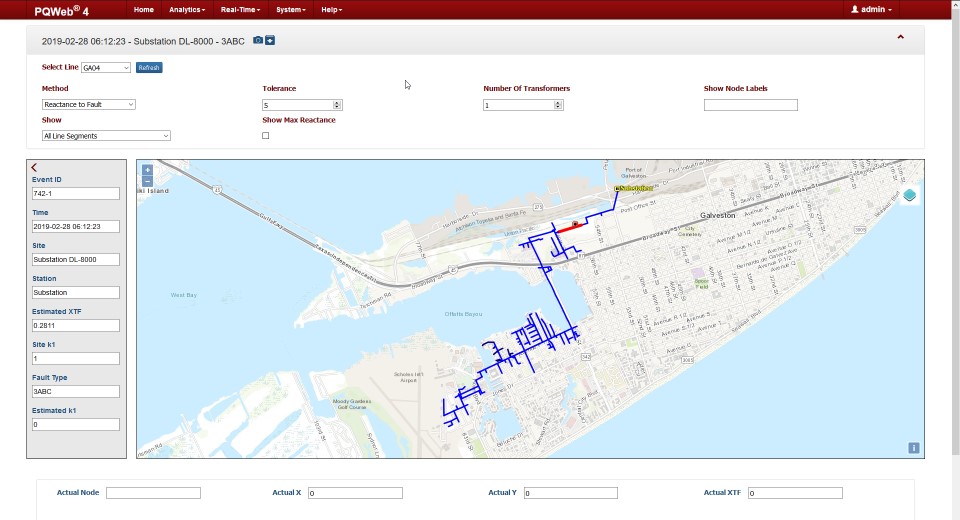
Fault Viewer
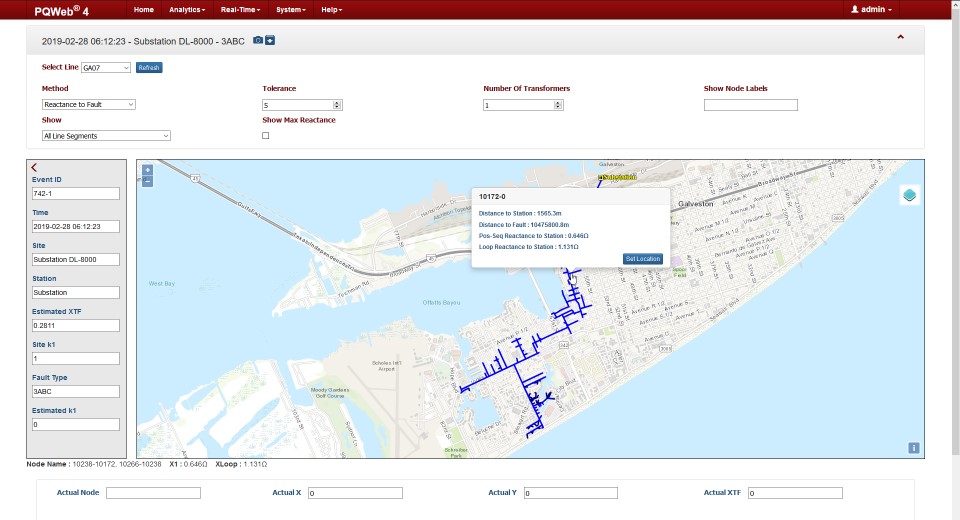
Feeder Segment Details
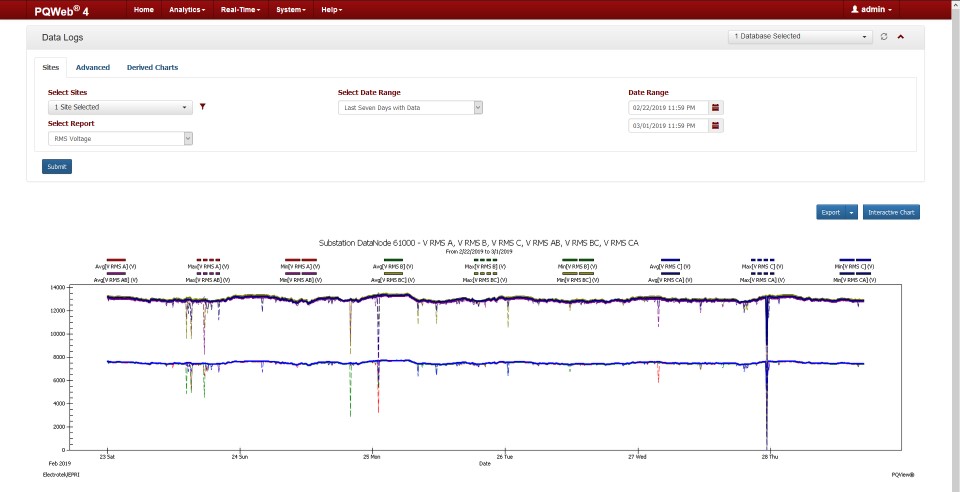
RMS Voltage Report
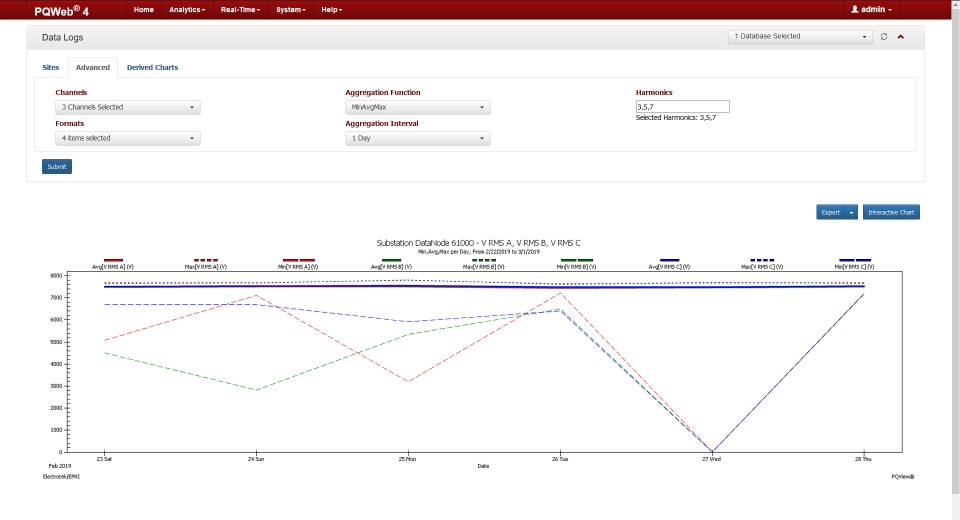
Data Aggregation
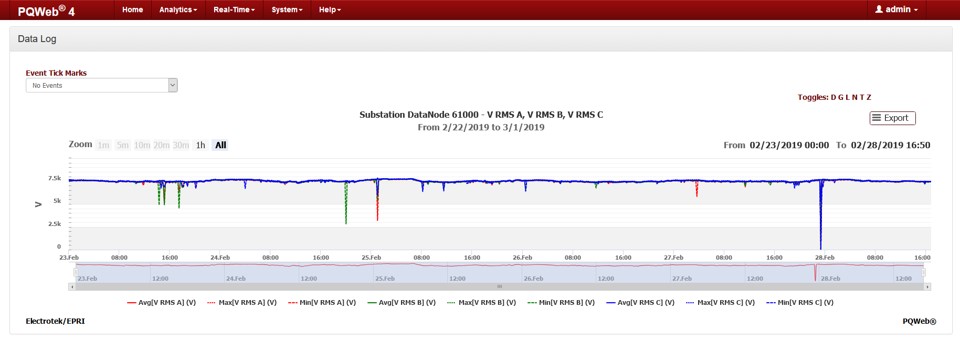
Data Log Chart
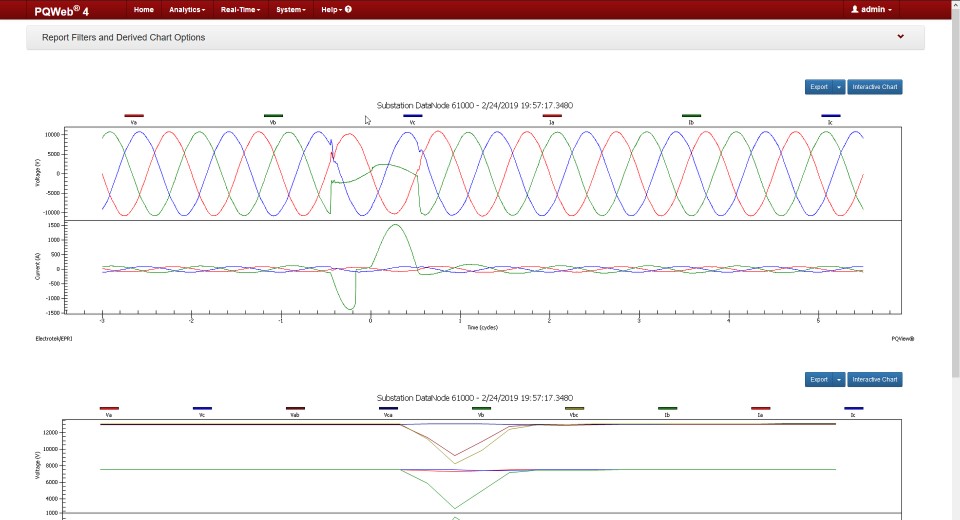
Event from Data Log Chart
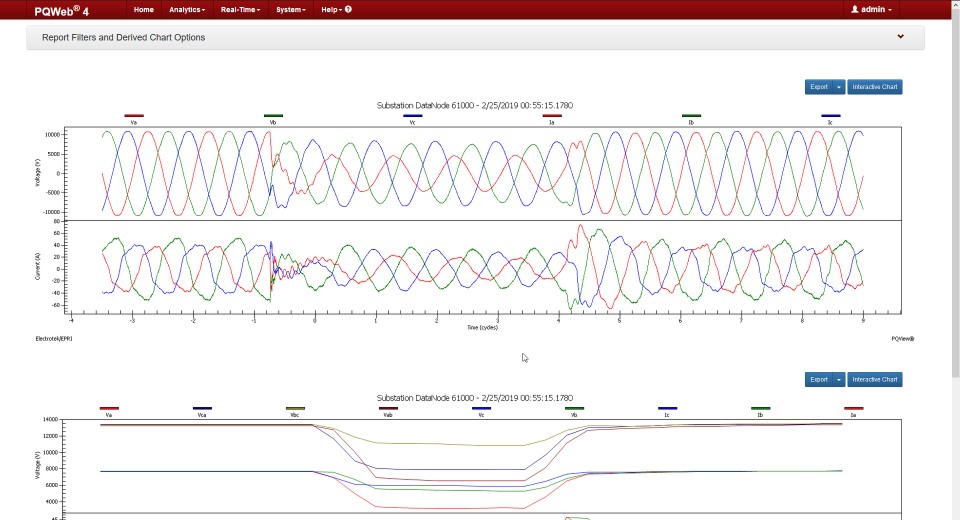
3-Phase Event Detail
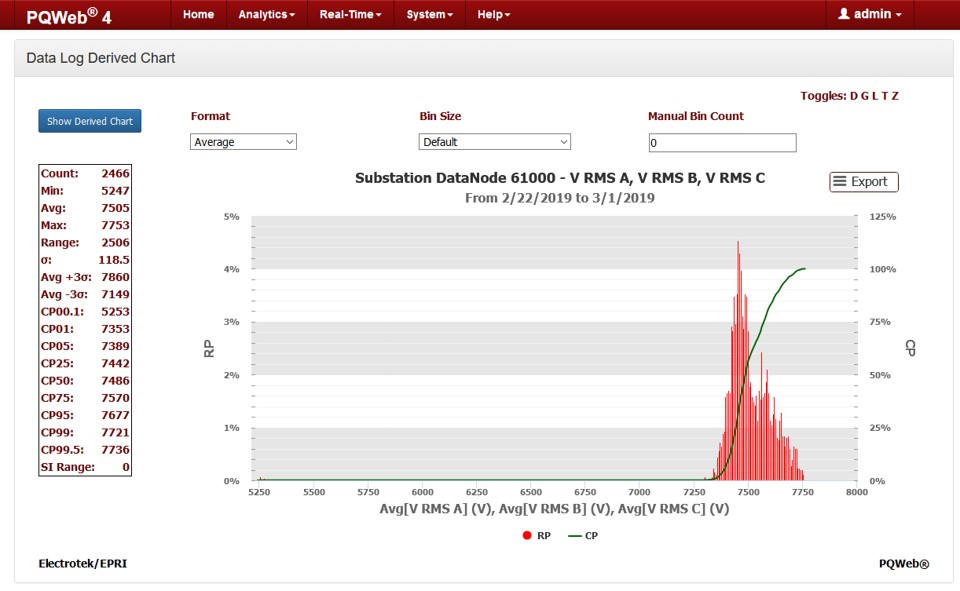
Data Log Histogram
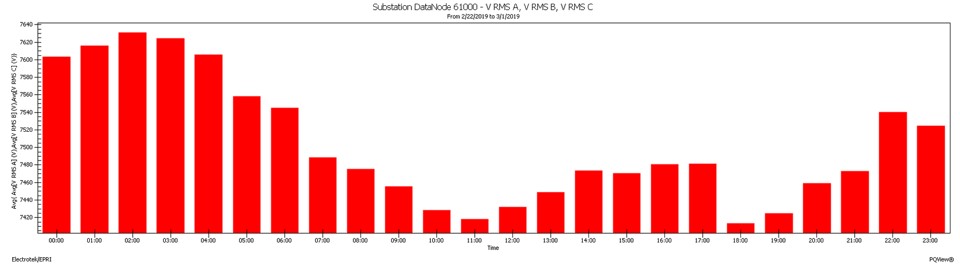
Profile Derived Data Log Chart
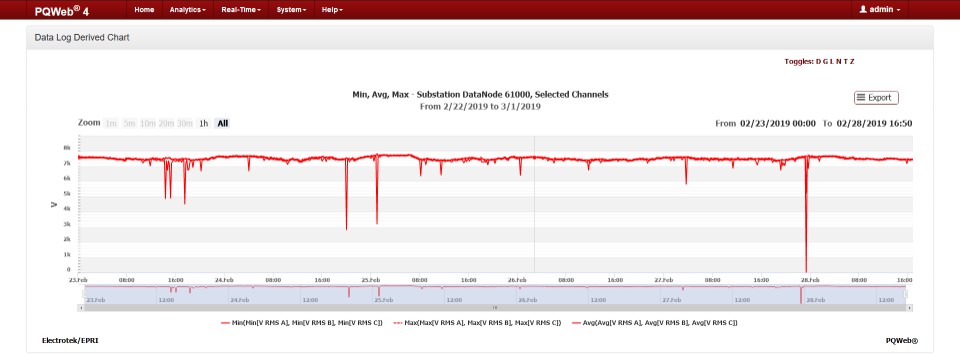
Min/Avg/Max Derived Chart
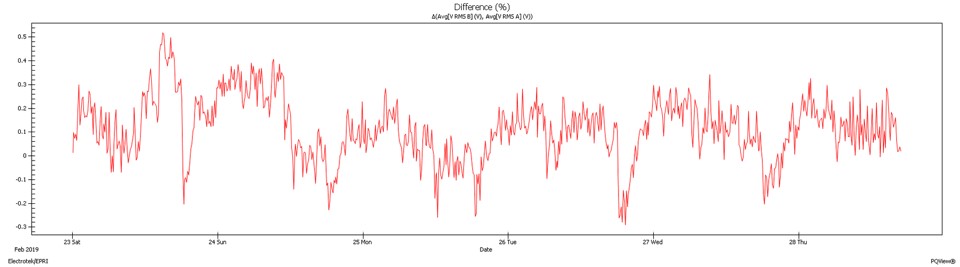
Percent Delta Derived Chart
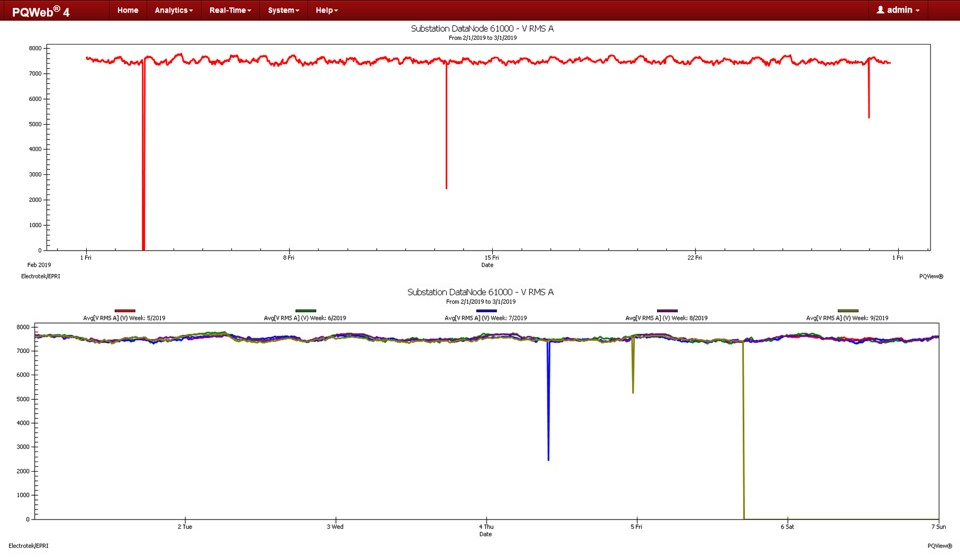
Crosstab by Week Derived Chart
Also available per day, week, and year.
Powerful PQView Features

State-of-the-art power quality data analytics via static, interactive and derived charts

Flexible compliance reporting that supports virtually any need

Direct download capabilities for a variety of supported devices

A single point of integration — use the same analysis tool regardless of data source

Flexible installation options — use PQView on a single server or across multiple machines

Device-agnostic, so you can use existing systems and/or integrate new ones
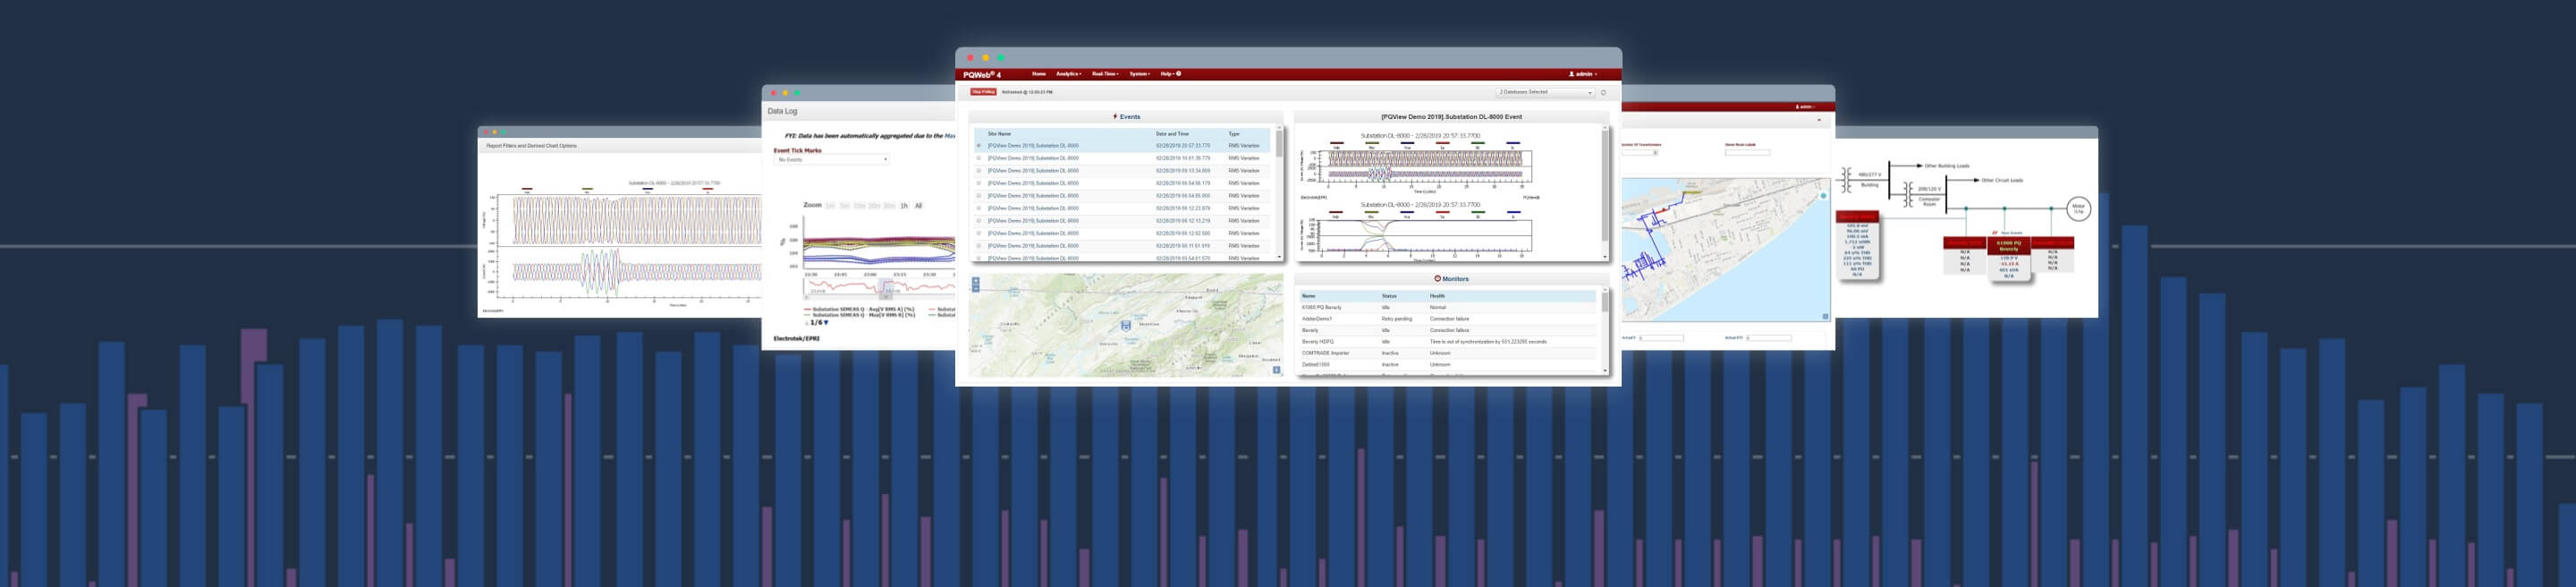
Options for Any Application
PQView 4 Express
Single-Server Installation
With only two installers required — and upgrades only requiring one — PQView Express is ideal for small organizations or those who wish to try out PQView in a simplified form.
PQView 4 Standard
Versatile for Various Systems
A step up from Express, Standard supports distributed installations and uses Microsoft IIS. Recommended for systems with 50+ monitors and more complex infrastructures.
PQView 4 Professional
Comprehensive Support
With all of the features of Express and Standard, Professional adds support for Windows Authentication, MS Access and SQL Azure, as well as additional advanced analysis options.