 Skip to the content
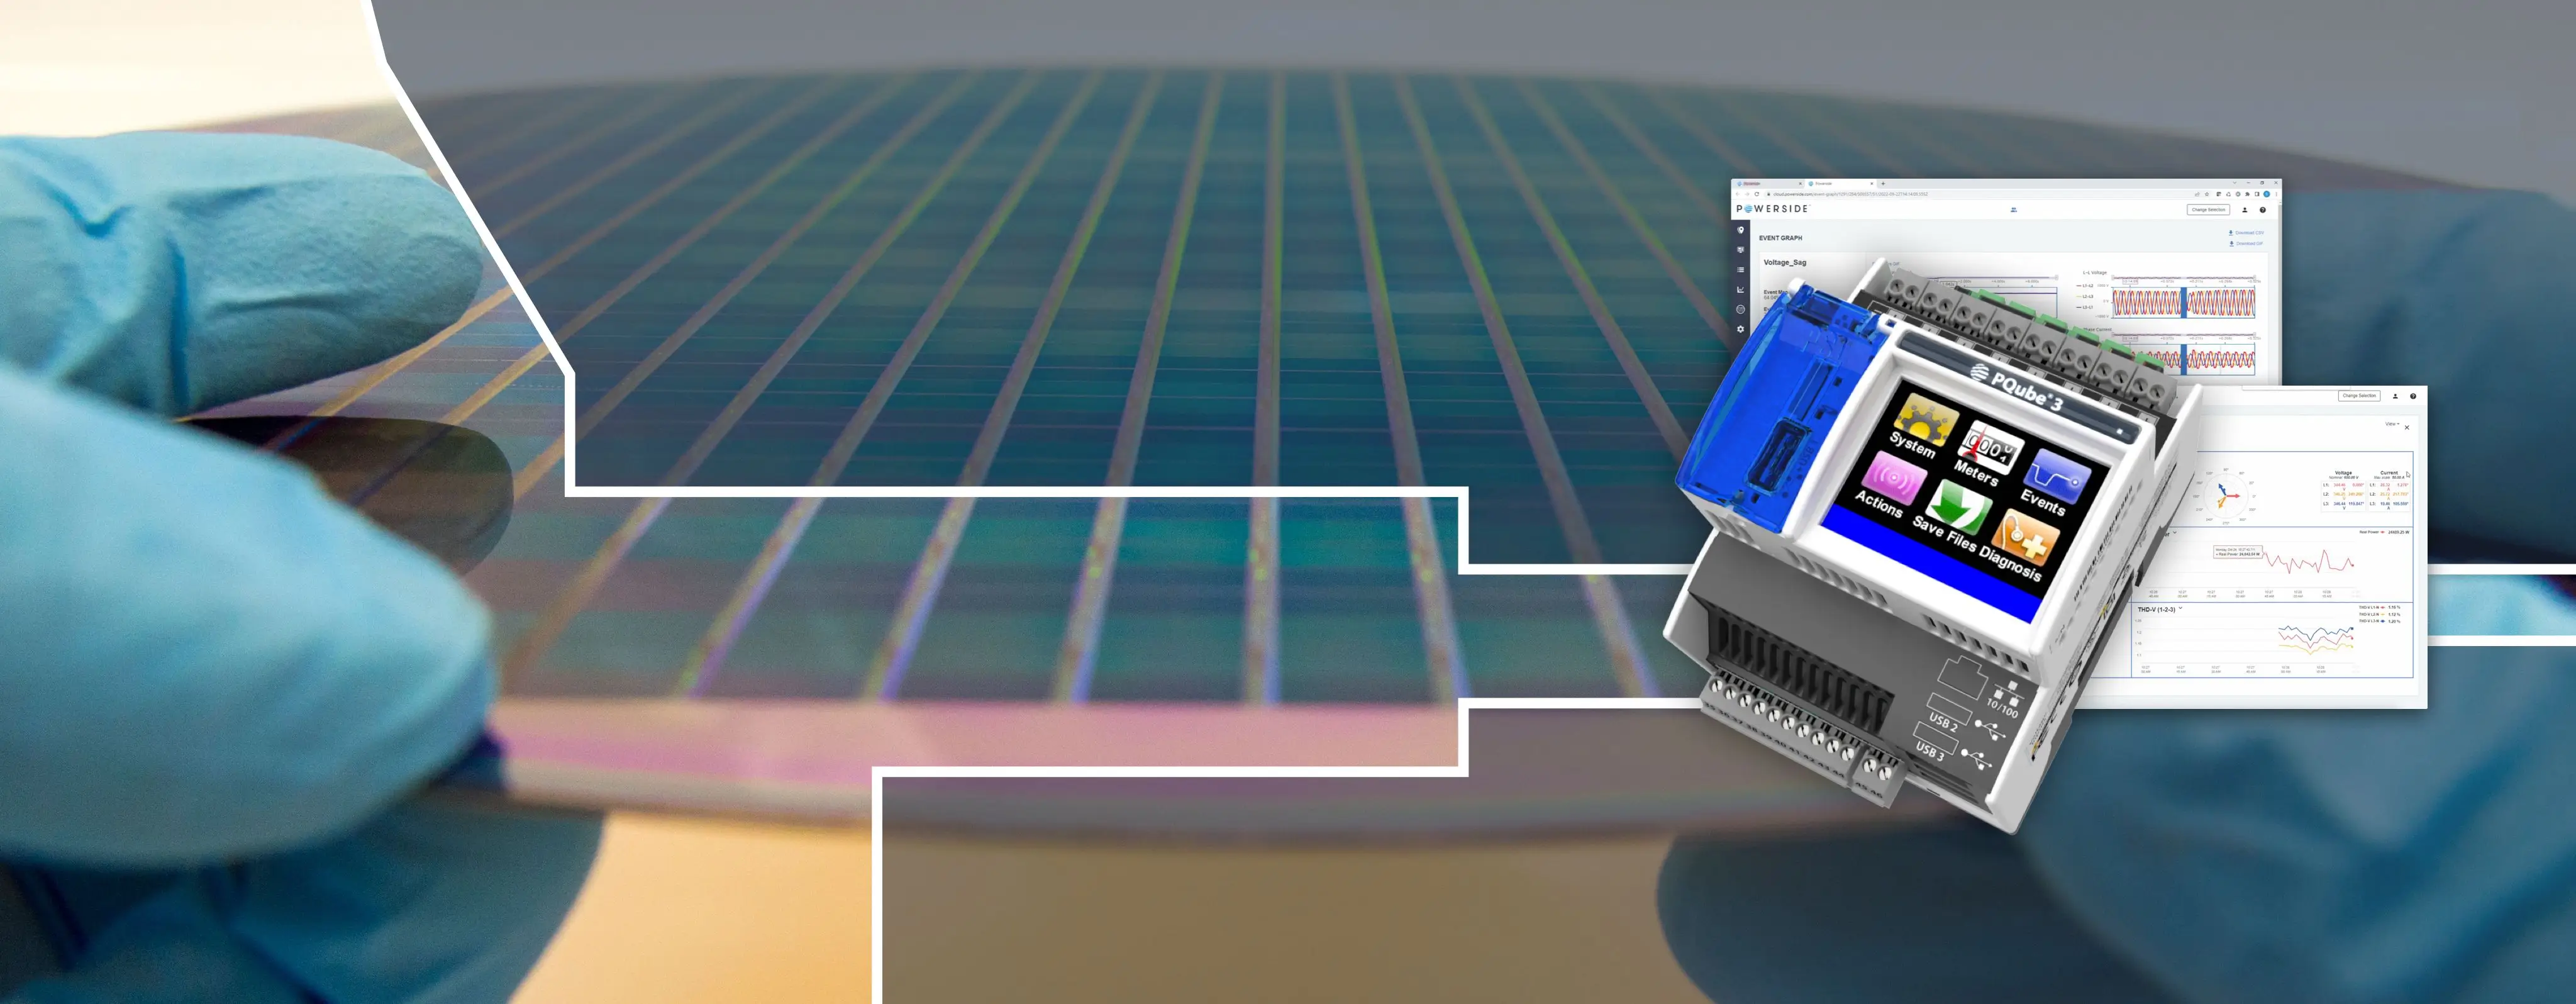
Electrical systems are evolving to support today’s increasingly sensitive technologies, from AI-driven data centers to semiconductor manufacturing. Knowing that the resilience of these critical systems is paramount, keeping on eye on their power quality is more critical than ever. Even brief voltage disturbances can disrupt operations, damage equipment or create costly downtime.
That’s why standards have been developed that define the range of conditions under which systems should continue operating. The most universal of these standards for equipment designers, utilities and distribution grids is the Information Technology Industry Council (ITIC) curve. These conditions note that at its simplest level, equipment should run reliably when operating inside the curve envelope, but may malfunction if operating outside of it.
In this article, we’ll define the ITIC curve and outline what power quality conditions it captures. By the end, you’ll have a deeper understanding of how to leverage this standard to better maintain the power feeding your critical systems.
What Is the ITIC Curve?
The ITIC curve is a refinement of the original Computer & Business Equipment Manufacturer’s Association (CBEMA) curve first introduced nearly 50 years ago to help define how computer systems and electronic equipment should be designed to tolerate the most common power supply disturbances.
Today, the ITIC curve is one of the most referenced standards in power quality analysis, especially with society’s growing reliance on computation and AI.
The curve establishes boundaries inside which equipment should be designed to withstand power quality effects and continue to run, often in applications regarding IT equipment. It also identifies whether incoming voltage conditions are likely to:
- Allow equipment to continue operating normally
- Cause operational disruption
- Potentially damage equipment
It is broken into upper and lower limits, and is primarily intended for 120V, 120/280V and 120/240V single phase systems. Nevertheless, it can be used in evaluating individual phase impacts on LV and MV distribution systems.
Conditions Captured in the ITIC Curve
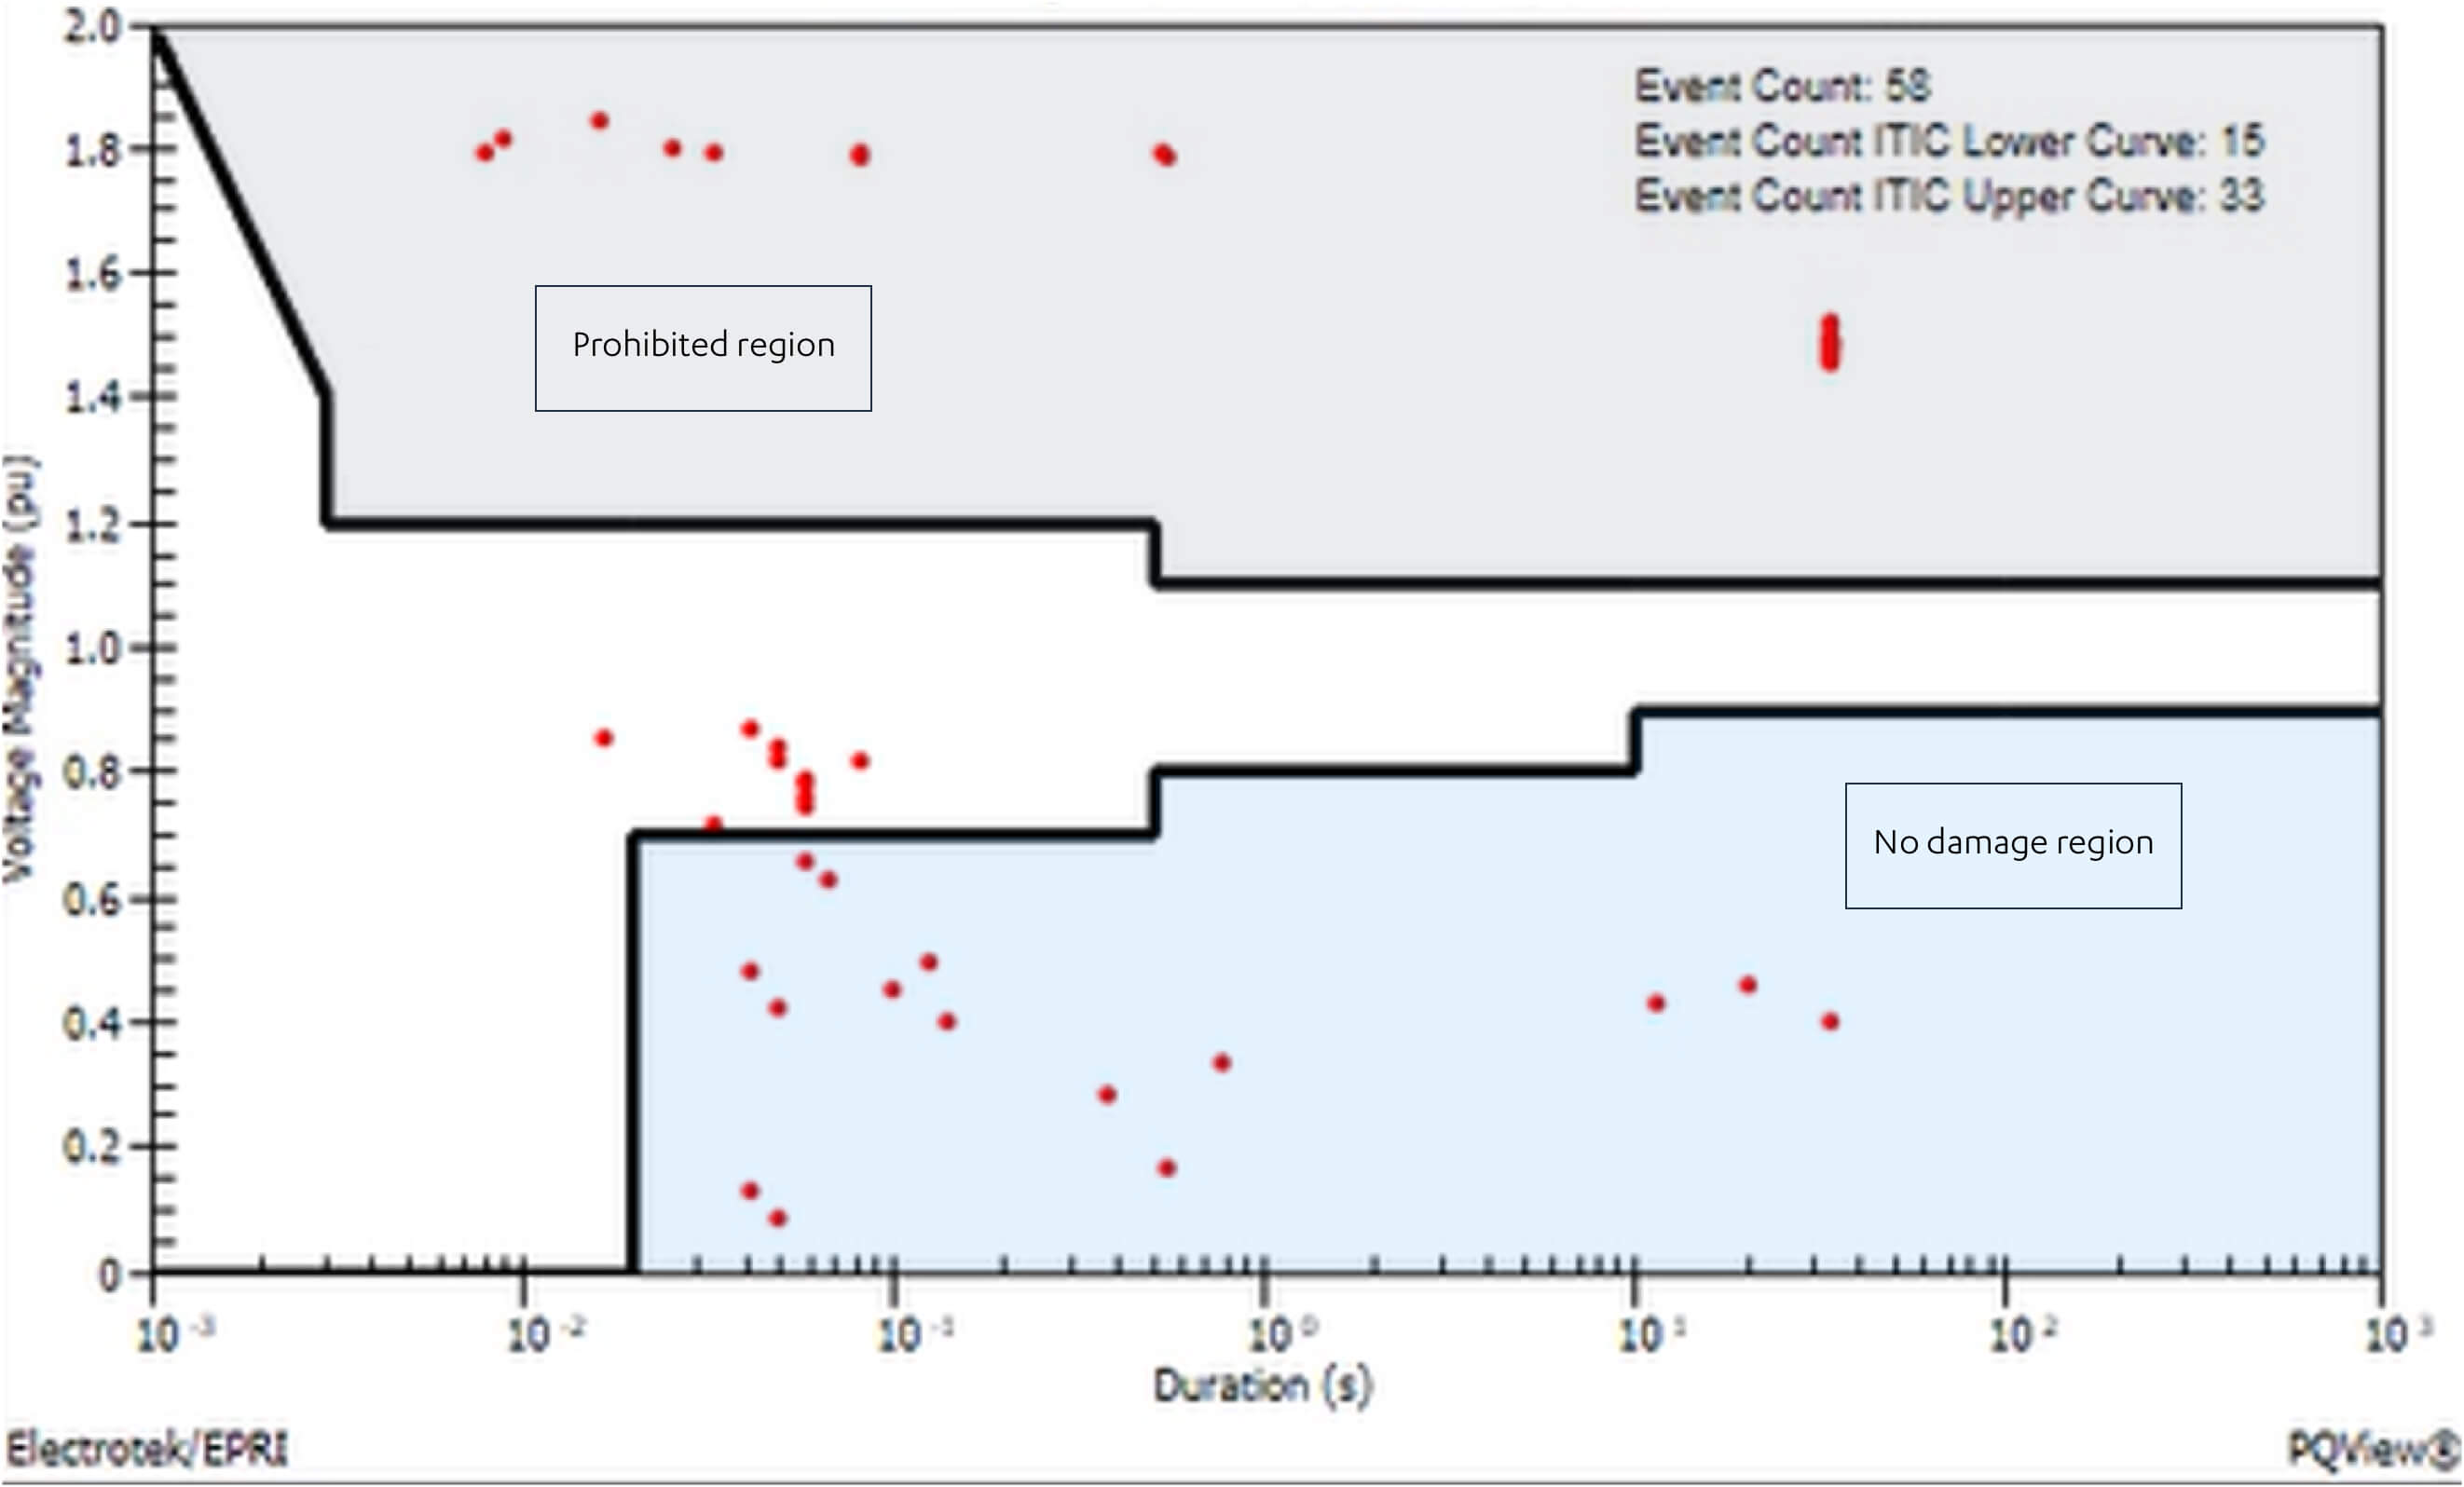
Figure 1: Scatter plot details of RMS variation magnitude duration. The region below the curve shows no damage, and the prohibited region is above.
Nominal Voltage: 120V RMS, 60 Hz, shown as the 100% Y-axis line.
Steady-State Tolerance: +/-10% from nominal voltage. Shown in the right portion of the ITIC curve.
Voltage Swell: Up to 120% of the RMS nominal voltage with duration up to 0.5 seconds.
Voltage Sag: Commonly caused by utility faults, facility faults or large motor starts. There are two commonly accepted RMS voltage sag thresholds:
- Voltage may drop to 70% of nominal voltage for no longer than 0.5 seconds (30 cycles)
- Voltage may drop to 80% of nominal voltage for no longer than 10 seconds (600 cycles)
Low-Frequency Decaying Ringwave: Results from capacitor banks switching/power factor correction. The value of the transient varies from 140%–200% and occurs near the peak of the nominal voltage waveform.
High-Frequency Impulse and Ringwave: These regions, shown on the far left of the ITIC curve, capture transients typically caused by lightning strikes.
Voltage Dropout: Includes both severe voltage sags and complete interruptions, followed by immediate restoration of the nominal voltage. Interruptions may last up to 20 milliseconds (1.2 cycles).
No-Damage Region: Events within this region are not expected to physically damage IT equipment, though normal operation may still be interrupted.
Prohibited Region: Voltage events within this region may result in equipment damage or failure.
How the ITIC Curve Applies to Power Monitoring
The ITIC curve plays a major role in power quality monitoring and reliability-focused initiatives. One key application is proactively correcting problems before they impact reliability by applying System Average RMS Frequency Index (SARFI) monitoring against the ITIC curve. SARFI monitoring tracks the frequency and severity of voltage sags, swells, interruptions and other events against defined thresholds, like the ITIC curve.
Because many power quality disturbances occur in fractions of a second — captured on the X-axis of the ITIC curve — effective monitoring requires specialized power quality instrumentation capable of detecting such high-speed behavior.
The shorter the event duration you want to detect, the more advanced the monitoring equipment must be.
Detect What Traditional Power Analyzers Miss
Traditional power quality analyzers often fail to capture the fast transient events that can negatively impact sensitive operations. Consequently, utilities and industrial facilities are increasingly relying on Class-A power quality analyzers, like Powerside’s PQube® 3, for advanced visibility into system behavior.
The PQube 3 is specifically designed to detect high-frequency transients and granular power quality events that conventional analyzers may miss. As a Class-A power quality analyzer, the PQube 3 provides:
- Detailed waveform and RMS event analysis
- High-speed transient detection
- Advanced voltage event characterization
- Comprehensive visibility into system behavior
These capabilities help organizations identify and correct power quality issues before reliability can be impacted.
Turn Power Quality Monitoring Into Proactive Action
When paired with QubeScan Monitoring Software, the PQube 3 enables organizations to monitor potentially damaging voltage events against ITIC thresholds in real time.
In one recent case study, a utility using a PQube 3 analyzer paired with QubeScan software detected 149 high-frequency impulse events that would have otherwise gone unnoticed. This allowed operators to take proactive corrective action to prevent outages and catastrophic equipment failure.
This level of far-sighted visibility is especially important in high-fidelity industries like semiconductor manufacturing, where even minor power disturbances can create significant operational consequences. Powerside has a long history of supporting the semiconductor industry, as seen in our PQube 3 analyzers being the standard on many semiconductor fabrication tools. Powerside equipment is also used to validate and certify equipment resilience through voltage sag testing using their Industrial Power Corruptor (IPC) systems.
Further, by using the adaptable QubeScan platform, Powerside can customize alert envelopes to suit individual applications and customer equipment beyond that of the published standards.
Build Resilience Through Deeper Visibility — with Powerside
Understanding how voltage events align with standards like the ITIC curve provides critical insight into whether systems are operating within acceptable boundaries or moving toward potential disruption and damage.
By combining high-resolution monitoring with intelligent analytics, like with PQube 3 and QubeScan, organizations gain the visibility needed to detect hidden power quality issues and improve system resilience.
See how Powerside can provide the in-depth visibility needed to proactively identify system problems and take corrective action.