Uninterruptible Power Supply Monitoring with the PQube® 3e
Provided end-to-end visibility into UPS performance by monitoring incoming AC, outgoing AC, and DC bus behavior, enabling verification of UPS response, efficiency, and storage performance during outages
Improved reliability of mission-critical systems by enabling continuous UPS compliance tracking, automated outage alerts, and data-driven troubleshooting of harmonics and component failures
An uninterruptible power supply (UPS) has three monitoring points of interest: incoming AC power, outgoing AC power and the DC bus that interfaces with the battery or capacitor bank power storage system. The PQube® 3e power quality analyzer is ideal for monitoring one or all three of these points of interest. UPS monitoring can be done for evaluating and testing a UPS and permanent monitoring for UPSes installed in critical locations, such as data centers, critical server racks and computer systems, semiconductor manufacturing and more.
The PQube 3e power quality analyzer can be used to:
diagnose problems with critical load protected with a UPS
prove the proper response of your UPS in unplanned outage conditions
measure UPS efficiency
investigate and verify storage response time
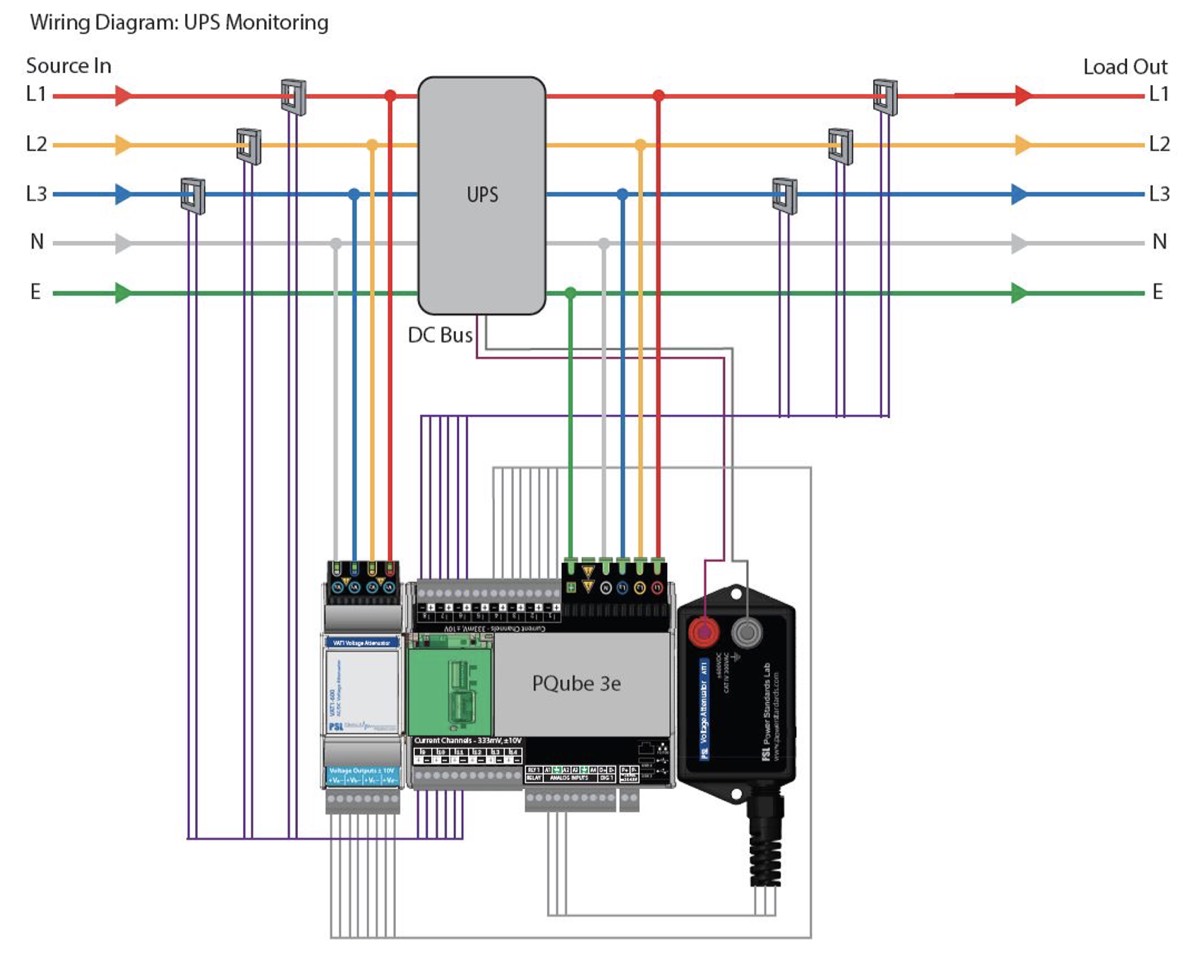
Using modules and current transformers (CTs) available from Powerside, the PQube 3e quickly installs for temporary or permanent monitoring of the UPS. The CTs are split-core and can be installed around the insulated cables. The voltages can be measured by leads that connect to the various monitoring points and can be directly wired to the PQube 3e and its modules.
Figure 1 | Data centers use power quality monitoring to monitor the health and operations of their UPS
Get a 360-degree view of your UPS in operation
UPS monitoring can provide many benefits:
Data files retained in the PQube 3e serve as a record of whether or not the UPS is operating in compliance with its technical specifications
DC bus in the UPS can be monitored to evaluate battery storage characteristics and trends
If the PQube 3e is networked, emails can be sent to alert on outages and problems with the UPS
Power system harmonics can be recorded, analyzed and used to troubleshoot frequent component failure
Data can be consolidated into reports using the Powerside Report Writer software
Data files are available in CSV format, allowing the customer to do their own data consolidation, graphing and reporting
Powerside customers have deployed 80,000+ PQube 3 systems in a wide range of mission-critical monitoring applications. The system is adaptable and easy to use.
UPS monitoring with the PQube 3e gives transparency into the operation of your UPS and alerts you to outages and problems.
The PQube 3e and its modules are quite compact and can be installed in various convenient locations, including a server rack.
Equipment
Quantity Needed
Purpose and Notes
PQube 3e (PQUBE3-PQ-E08N-E06N-XXXX)
1
Records AC, DC power disturbances, HF impulses and 2kHz~150kHz voltage conducted emissions. Class A IEC 61000-4-30 Ed3, 14 current channels four-quadrant energy, Class 0.2 accuracy. Modbus, BACnet, DNP3, (S)NTP, SNMP, emails. 32GB internal memory.
VAT2-600 (VAT2-600-XXXX)
1
Used to input the incoming AC voltage into the PQube 3e.
ATT1 (ATT1-0600V-PQ3-XXXX)
1
Used to input the DC bus voltage into the PQube 3e.
Current Transformers
6 – 9
CTs need to be sized for the ampacity of the UPS load. At a minimum, it is recommended to measure the incoming and outgoing current of the UPS. Further, neutral currents and ground currents can be monitored with the addition of more CTs.
ENV2 EnviroSensor
1 – 2
Optional. This plugs into the PQube 3e via its USB cable and continuously records temperature, humidity, pressure and vibration.
Please note: Your UPS application may vary from the specific case used for this application note. Please consult with a Powerside expert to ensure the right selection of modules and equipment for your UPS monitoring project.
Figure 2 | The PQube 3e and its modules use CTs and voltage leads to provide 360-degree monitoring of the AC and DC circuits of the UPS.
How to analyze actual UPS monitoring results
Powerside recently performed thorough testing on a UPS system and recorded the results using a PQube 3e. The following GIF graphs were auto-generated by the PQube 3e, and the sidebar annotations are our comments.
This is a graph auto-generated by the PQube 3e following an intentional 1-second interruption of incoming power to the UPS. The UPS performed normally in this case. AC current and voltages are in RMS.
Figure 3 | PQube 3e graph following an intentional 1-second interruption of incoming power to the UPS when the UPS preformed normally.
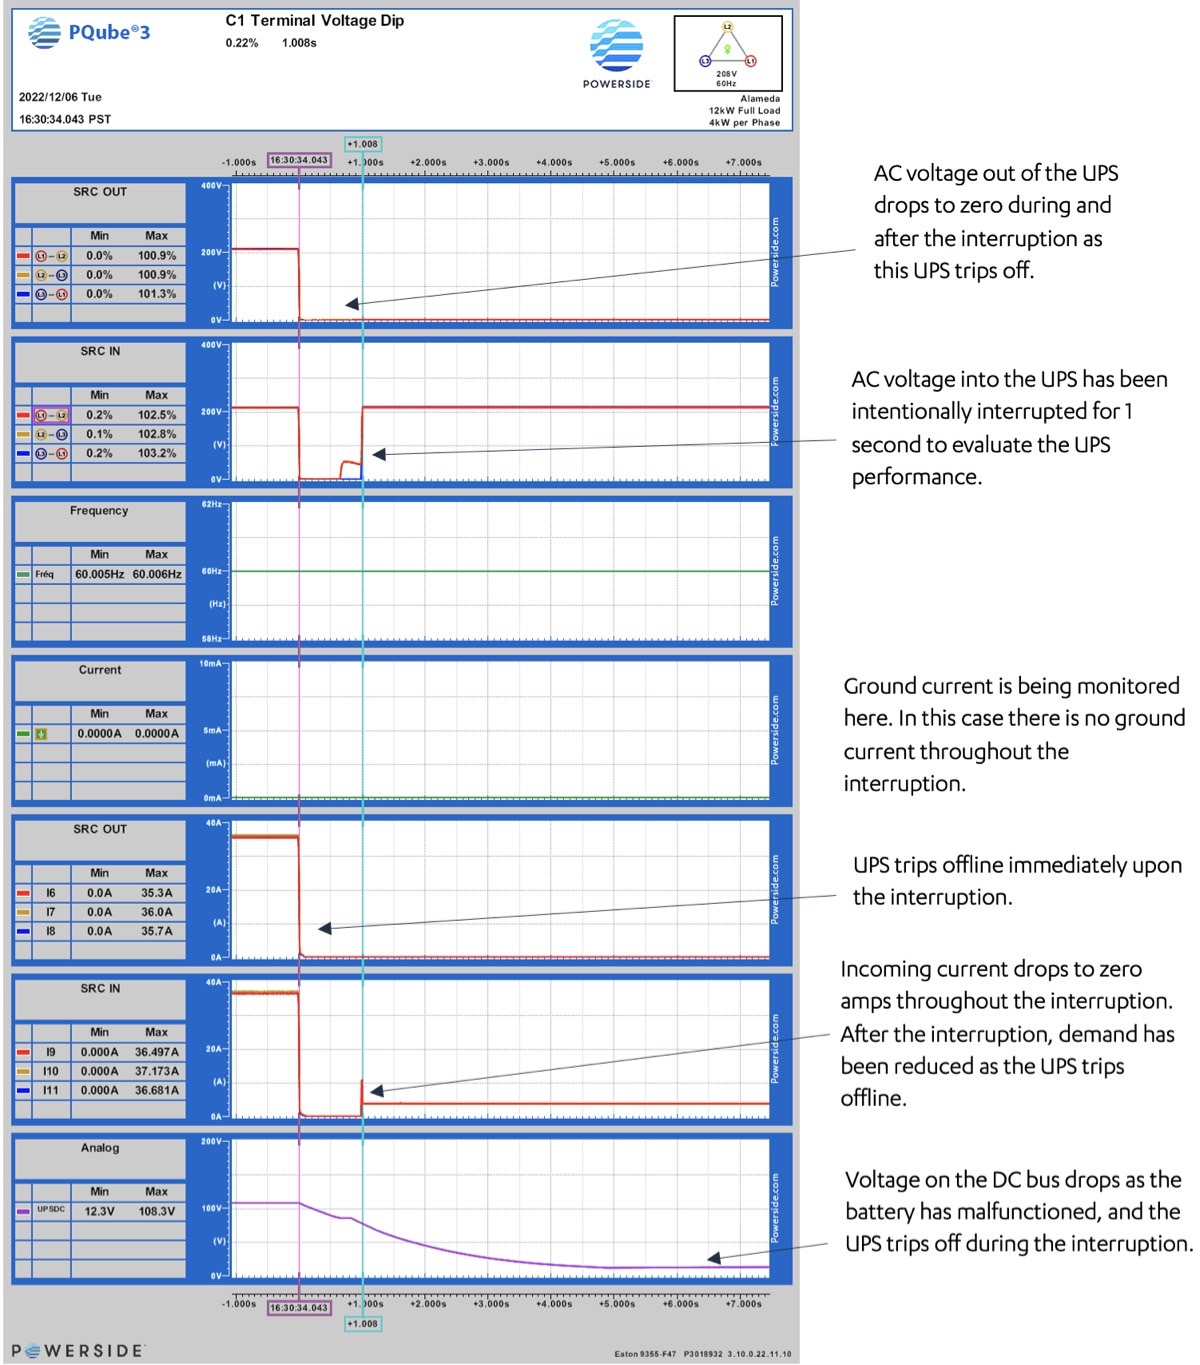
This is another GIF graph auto-generated by the PQube 3e following an intentional 1-second interruption of incoming power to the UPS. The UPS battery malfunctioned in this case. AC current and voltages are in RMS.
Figure 4 | PQube 3e graph following an intentional 1-second interruption of incoming power to the UPS when the UPS malfunctioned.