Powerside has the unique capability to use its powerful analysis tools to optimize and customize its correction proposals – giving you peace of mind that our products will deliver what is best for your electrical system.

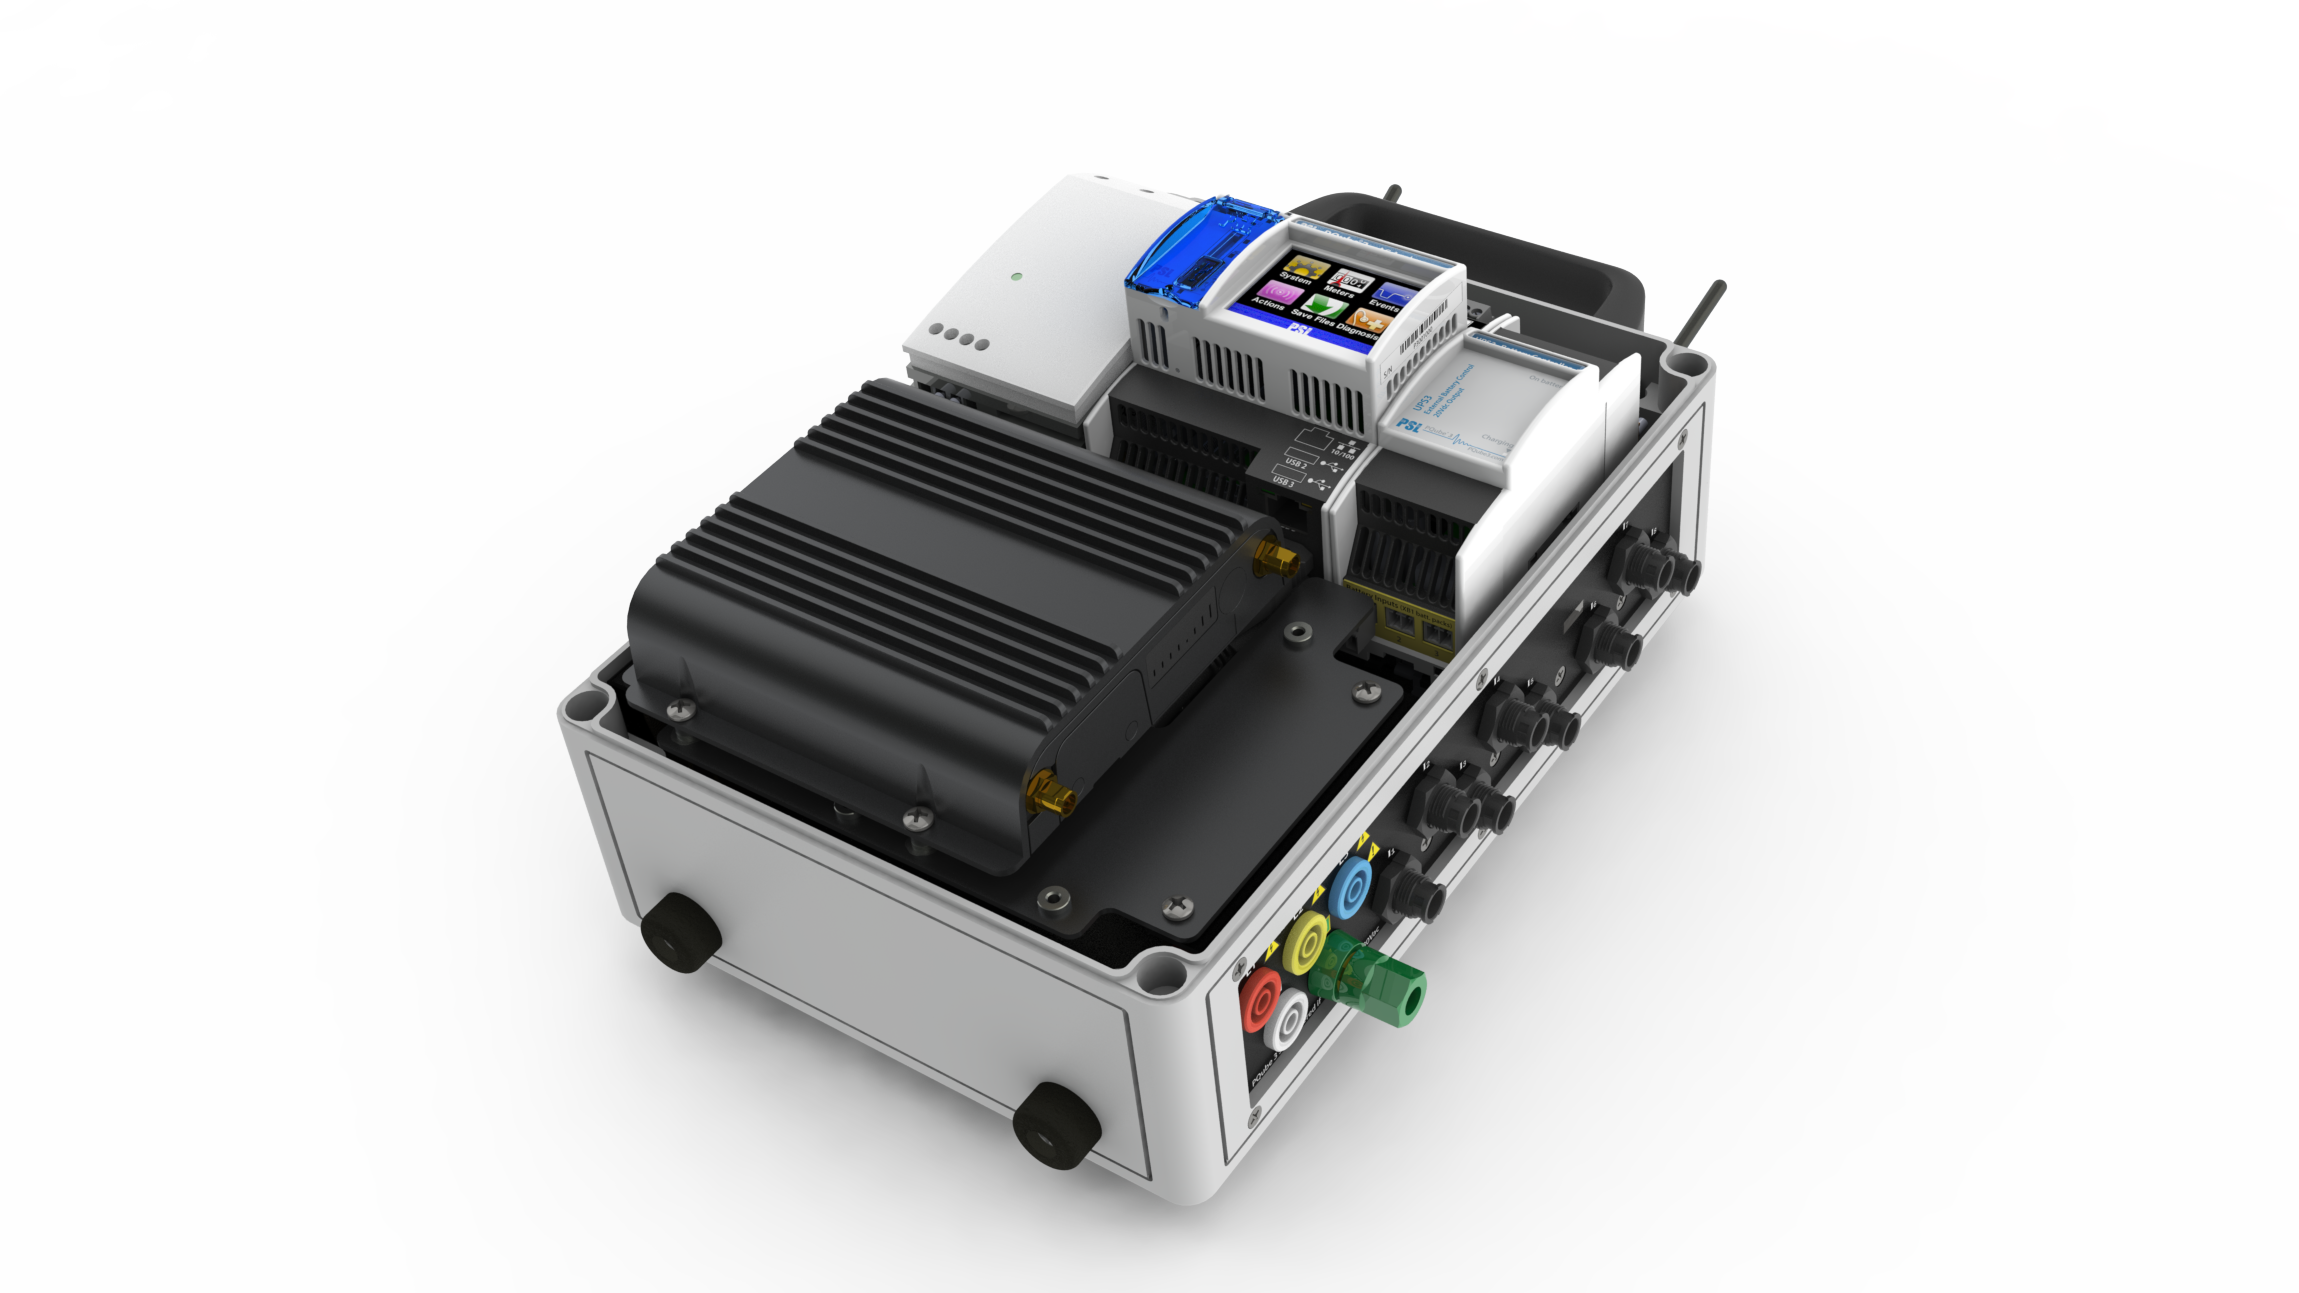
Sophisticated power analyzers like the PQube® 3, has allowed Powerside to identify power quality events, power system trends, and seamlessly deliver data to customers that need to know if their electrical infrastructure is being compromised.
Whether embedded as a permanent monitoring device or deployed in the field as a portable unit, the benefits of the PQube® 3 not only lies in the exceptional speed and quality of data but also in its communication capability.
Powerside is taking this one step further; and making the analyzer data available through an intelligent cloud interface bringing your data alive and helping us to find the best correction solution for your power system.
As an added value feature to our Power System Analysis offering, Powerside has set up onboard cellular modems to connect with its secure cloud-based platform. This further enhances the capability of the evaluation, allowing greater flexibility when analyzing customer’s site-specific data.
Our cloud solution has been developed to integrate, store, and customize data across multiple service data and measurement points.
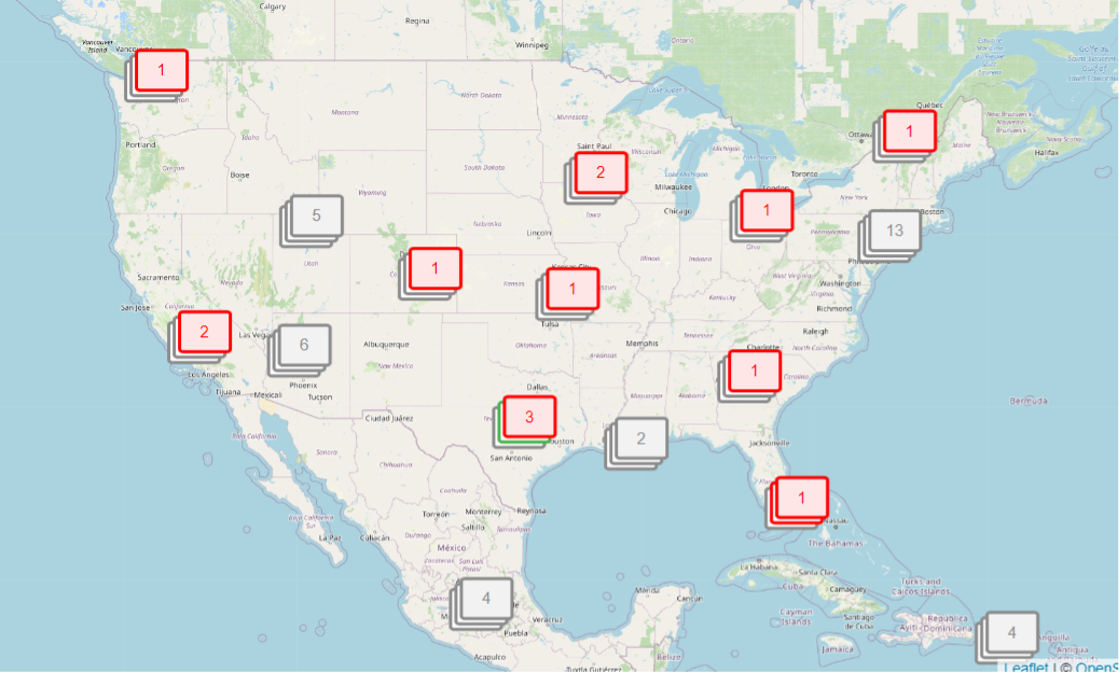
The system brings advantages of customizable fleet dashboarding and data acquisition for better management of your equipment across different sites… but it goes far beyond that
Powerside’s cloud platform also allows for a customized display of direct power quality data with the capability of trending and comparing data for your preferred time period. What this means is that we can review your load profiles, power factor, harmonics, and system behavior by day, week, or month and compare values to fully understand your system characteristics. The system allows configurable trend alerts beyond the already user-defined thresholds of the PQube® 3. This provides trend excursion analysis instead of just snapshots of a system deviation. The cloud analytics also allows us to simply to zoom in and out across all collected site data and live meters, helping our engineers to better model the system. Custom reports are also possible to help us better size and configure the system you need.
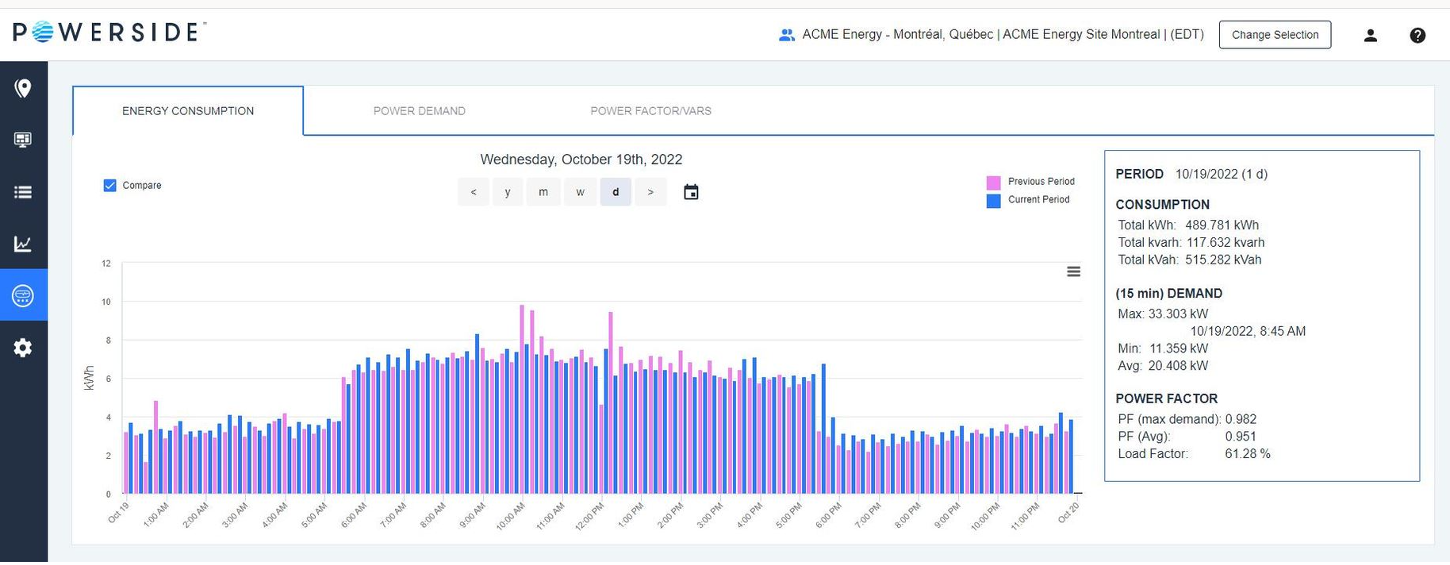
The Power System Analysis program includes the capability to compare multiple system characteristics relating to demand and consumption to trend reactive and apparent power.
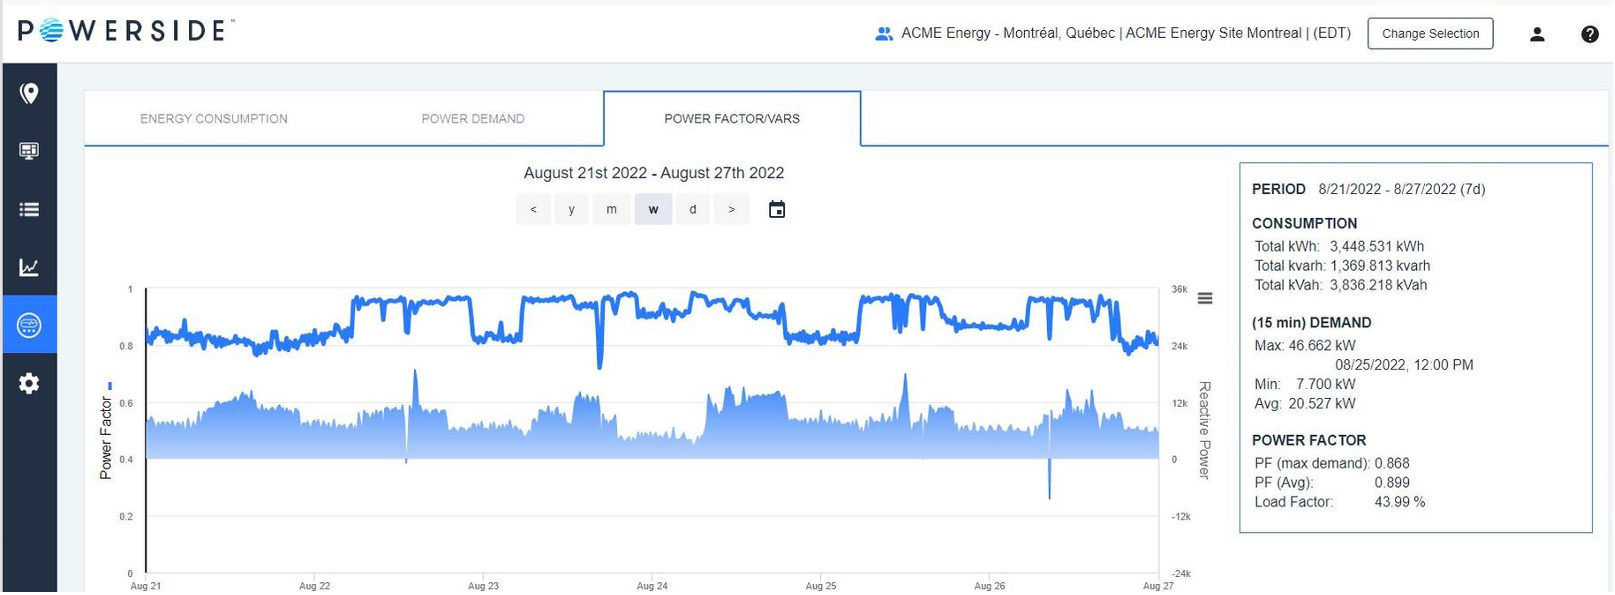
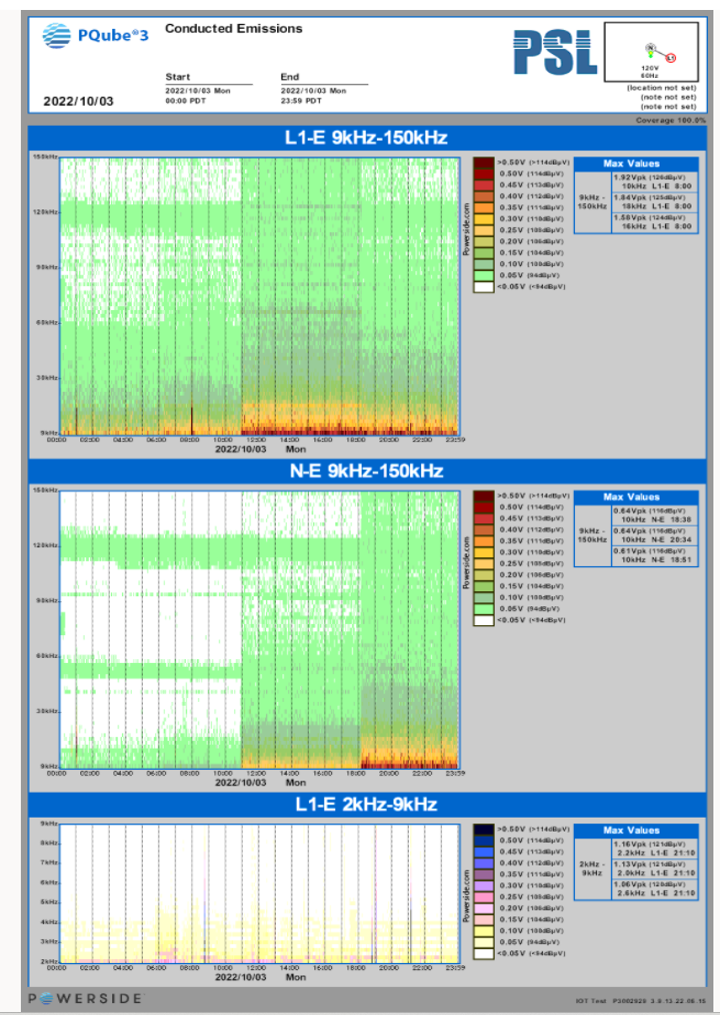
Interested in load profiles and imbalance? No problem. THD and Power Factor? Sure thing. Heat Maps for Conducted emissions and Flicker? Bring it on!
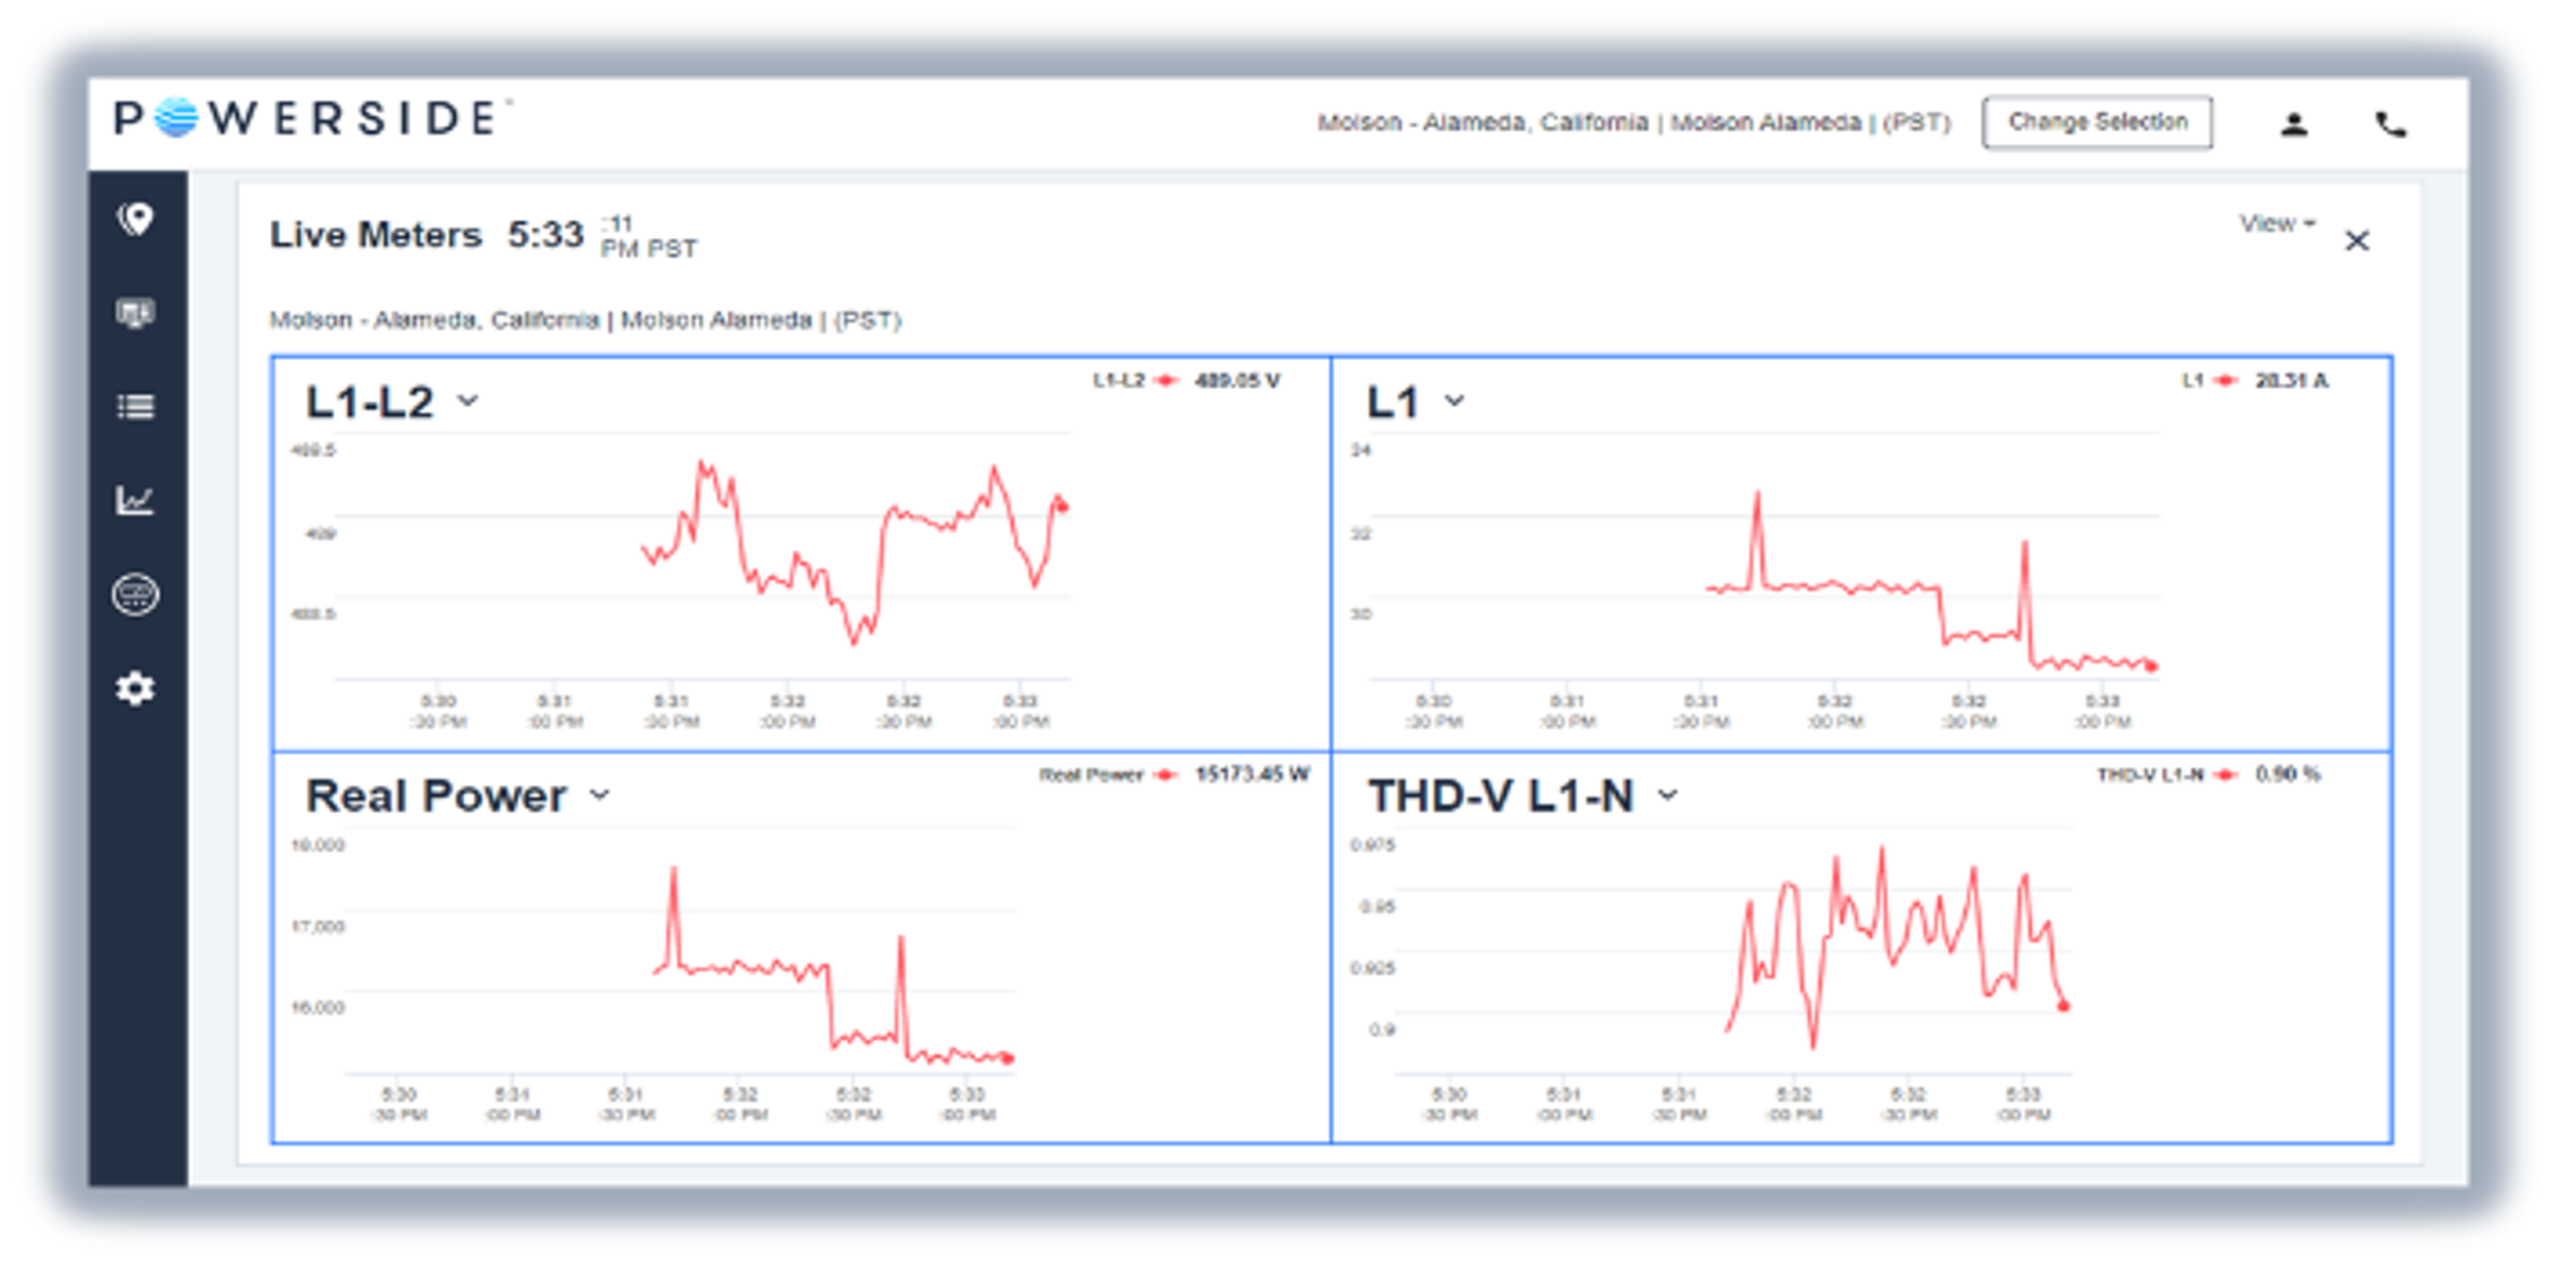
The remote connection to the PQube® 3 device enables us to troubleshoot, update Firmware, and change configuration files without the need to manually program on-site. IoT token keeps the unit secure so each user can individually access their system.
Below is an example of recent data from a large industrial application in South Dakota.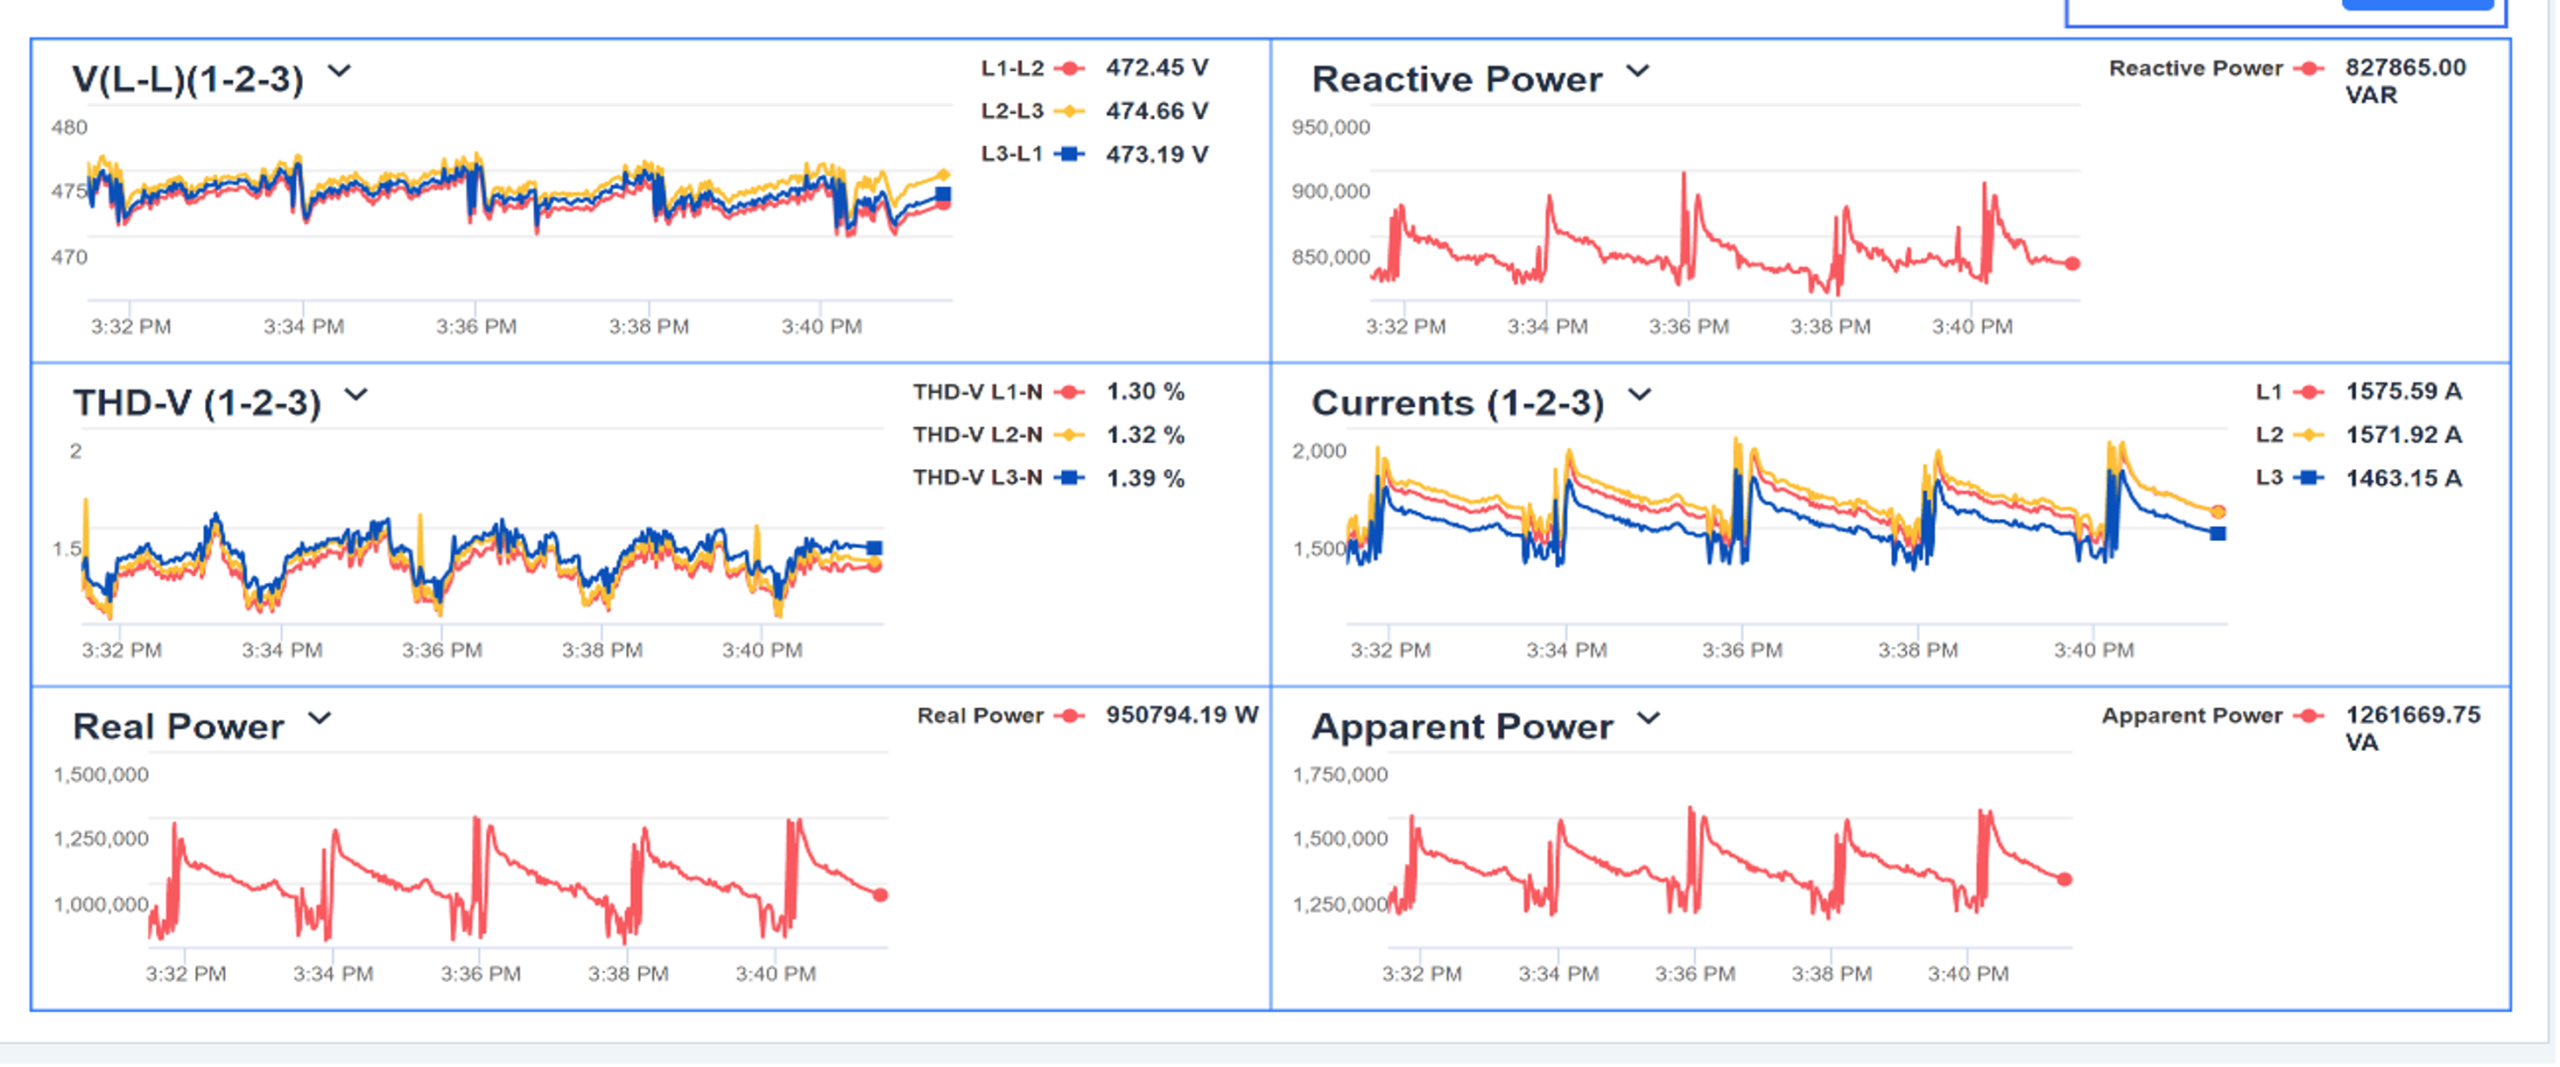
The ability to dive deeper into the cyclical nature of these loads, along with the true relationships between distortion and reactive power cycles are well beyond the resolution we would see from standard metering data. We then customize, overlay, and compare the data at different measurement points, phases, and loads. This makes the analysis and design of correction equipment more efficient and more reliable.
Without this analysis, correction equipment could easily be improperly sized if only considering mean data points or peak values. This data is a value add to our system and it brings value to our customers.
Beyond designing you the best Corrective equipment, we can also add in PQube® 3 hardware into the solution with a connection point that allows you to view your full power system and performance.